Category: Health Calculator

  • The Ideal Waist to Hip Ratio: The Ultimate Guide to Measuring Your Real Health

    The Ideal Waist to Hip Ratio: The Ultimate Guide to Measuring Your Real Health

    Introduction

    For decades, the fitness and medical industries have placed a heavy emphasis on the bathroom scale. We have been conditioned to believe that our total body weight—and by extension, our Body Mass Index (BMI)—is the ultimate arbiter of our overall health. However, modern medical science has proven that this is a fundamentally flawed approach. It is not just about how much fat you have on your body; it is critically about where that fat is located. This paradigm shift has brought a much more accurate, revealing metric to the forefront of preventative medicine: the waist-to-hip ratio (WHR).

    Understanding your ideal waist to hip ratio is one of the most powerful, immediate ways to assess your risk for chronic lifestyle diseases. Unlike stepping on a scale, which cannot differentiate between heavy muscle mass, water retention, and dangerous abdominal fat, your WHR tells a very specific story about your internal biology. It measures the proportion of fat stored around your waist (which surrounds your vital organs) compared to the fat stored around your hips and buttocks.

    Why is this distinction so vital? Because fat is not completely uniform. The fat that sits underneath the skin on your thighs is biologically different from the fat that wraps tightly around your liver and pancreas. An unhealthy waist-to-hip ratio is a glaring warning sign for silent, metabolic issues like insulin resistance, type 2 diabetes, hypertension, and cardiovascular disease. Even if your BMI categorizes you as “normal weight,” a high WHR can quietly put you in a high-risk category—a phenomenon known in the medical community as “normal-weight obesity.”

    In this comprehensive guide, we will break down exactly what the ideal waist to hip ratio is according to global health authorities like the World Health Organization (WHO). We will provide you with step-by-step instructions on how to measure yourself accurately at home, explain the profound biological differences between “apple” and “pear” body shapes, and dive deep into why this simple measurement might just save your life. Whether you are beginning a weight loss journey, optimizing your athletic performance, or simply trying to improve your long-term longevity, mastering your WHR is the critical first step.

    What is the Waist-to-Hip Ratio (WHR)?

    The Waist-to-Hip Ratio (WHR) is a simple anthropometric measurement used by doctors, nutritionists, and researchers to assess fat distribution across the human body. To put it simply, it looks at how much girth you carry around your midsection compared to how much girth you carry around your hips.

    The Mathematical Definition

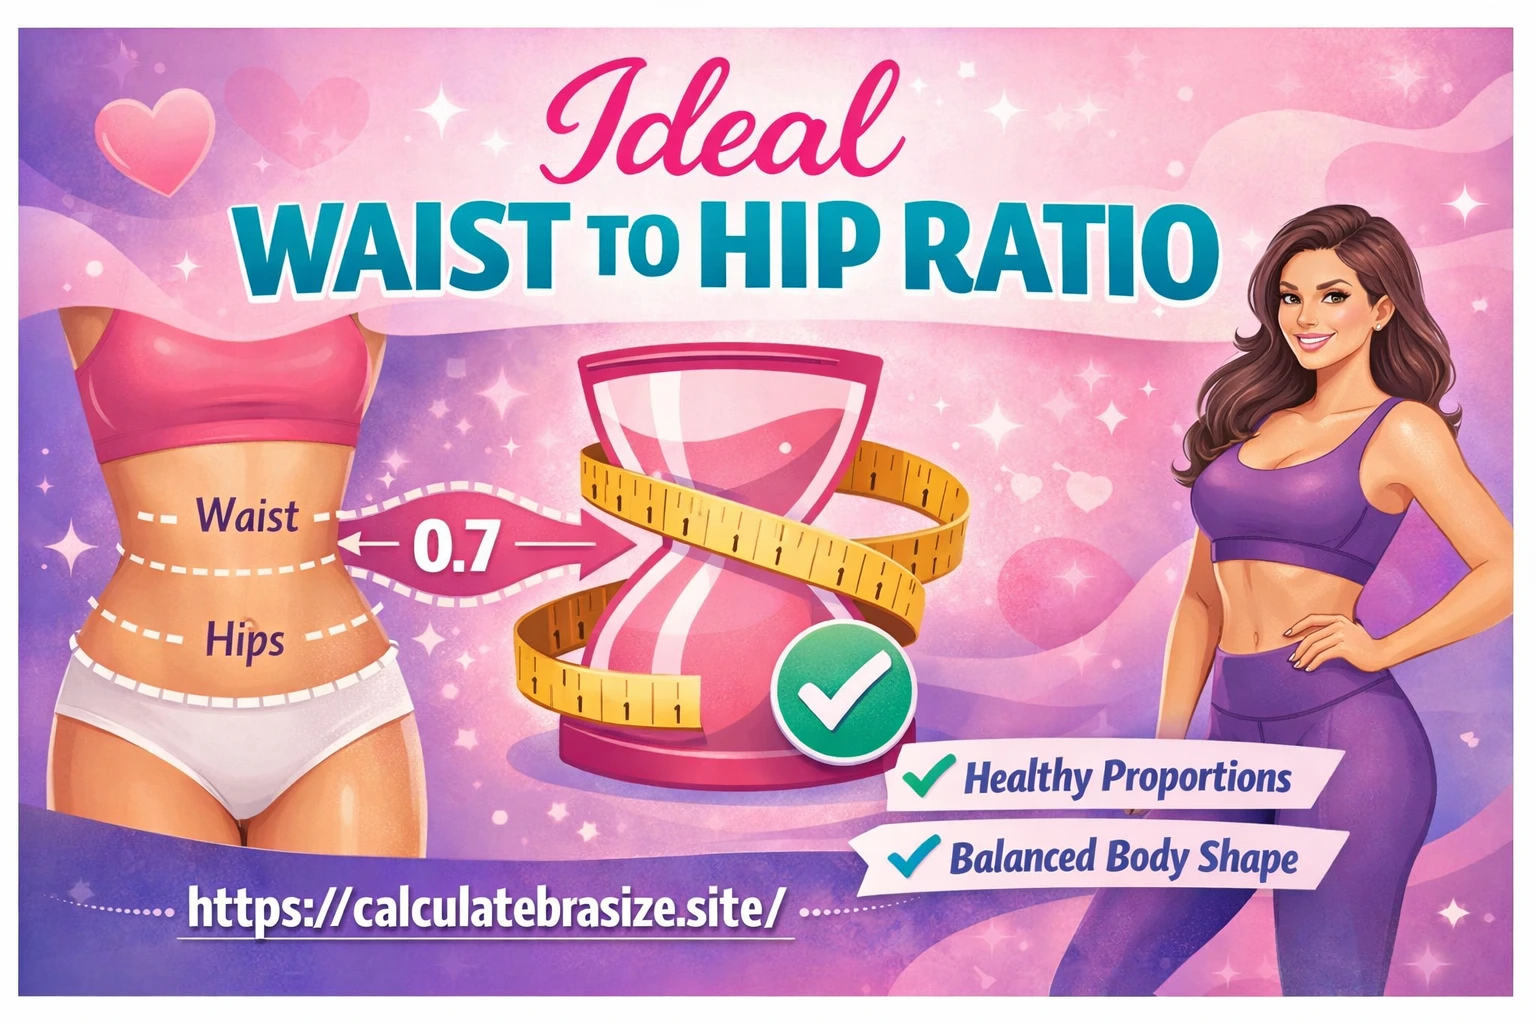
    Mathematically, the WHR is exactly what it sounds like: it is the circumference of your waist divided by the circumference of your hips. The resulting decimal number gives you a ratio.

    • Formula: WHR = (Waist Circumference) ÷ (Hip Circumference)

    If your waist is smaller than your hips, your ratio will be less than 1.0. If your waist is larger than your hips, your ratio will be greater than 1.0. While this mathematical formula is simple, the biological implications behind this number are immensely complex.

    Visceral Fat vs. Subcutaneous Fat

    To understand why the waist is compared to the hips, you must understand the two primary types of fat stored in the human body.

    1. Subcutaneous Fat: This is the “pinchable” fat that lives directly directly beneath your skin. It is the fat that accumulates on your thighs, buttocks, arms, and directly under the skin of your belly. While having excessive amounts of subcutaneous fat can strain your joints and increase your overall body weight, it is generally considered metabolically passive. The fat stored around the hips is almost entirely subcutaneous.

    2. Visceral Fat (Intra-Abdominal Fat): This is the hidden, dangerous fat. Visceral fat is stored deep inside the abdominal cavity. You cannot pinch it because it wraps itself around your vital internal organs, including the liver, pancreas, and intestines. Visceral fat is highly metabolically active. It acts almost like an invasive endocrine organ, actively releasing inflammatory cytokines (proteins), free fatty acids, and hormones into your bloodstream. This chemical release aggressively promotes insulin resistance, raises bad cholesterol levels, and increases systemic inflammation.

    Because visceral fat pushes the abdominal wall outward, a large waist circumference is the number one physical indicator of high visceral fat volume. Therefore, by dividing the waist (a proxy for dangerous visceral fat) by the hips (a proxy for benign subcutaneous fat), the WHR provides a remarkably accurate snapshot of your metabolic health risk.

    The Ideal Waist to Hip Ratio: Global Health Guidelines

    Health organizations around the globe have spent decades conducting epidemiological studies to pinpoint the exact ratio thresholds where health risks jump from low, to moderate, to severe. Because male and female bodies naturally store and distribute fat differently due to evolutionary biology and hormones, the ideal waist to hip ratio is heavily dependent on biological sex.

    World Health Organization (WHO) Standards

    The World Health Organization (WHO) has established the globally accepted clinical guidelines for what constitutes a healthy waist-to-hip ratio, and what crosses the line into dangerous abdominal obesity.

    Guidelines for Women:

    • Ideal / Low Risk: 0.80 or lower
    • Moderate Risk: 0.81 to 0.84
    • High Risk (Abdominal Obesity): 0.85 or higher

    Guidelines for Men:

    • Ideal / Low Risk: 0.90 or lower
    • Moderate Risk: 0.91 to 0.99
    • High Risk (Abdominal Obesity): 1.00 or higher

    Furthermore, the National Institute of Diabetes and Digestive and Kidney Diseases (NIDDK) strongly warns that any individual (regardless of sex) possessing a WHR over 1.0 is at an extreme risk for heart disease and other conditions linked to being overweight.

    Men vs. Women: Why the Difference?

    You will notice that women have a stricter (lower) threshold for an ideal ratio than men. This is not arbitrary; it is rooted in biological sex hormones.

    Estrogen and Fat Storage: Before menopause, women produce high levels of estrogen. Estrogen naturally encourages the body to store fat in the gluteofemoral region—meaning the hips, thighs, and buttocks. This evolutionary trait is designed to store energy reserves for potential pregnancy and lactation. Because women are genetically programmed to have wider hips and carry more subcutaneous fat in their lower body, a healthy woman’s waist should naturally be substantially smaller than her hips, hence the lower ideal ratio of 0.85.

    Testosterone and Fat Storage: Men, primarily driven by testosterone, do not possess the same genetic predisposition to store fat in their hips and thighs. When men gain weight, they are biologically programmed to store it directly in the abdominal cavity as visceral fat. Because men naturally have narrower hips and broader waists compared to women, their acceptable ratio is slightly higher (up to 0.90) before it is clinically classified as high-risk abdominal obesity.

    It is worth noting that after menopause, when estrogen levels plummet in women, their fat distribution pattern often shifts to mirror the male pattern, causing them to accumulate visceral fat in the belly at a much faster rate.

    How to Measure Your Waist-to-Hip Ratio Accurately

    The data is only as good as the measurement. A flawed measurement will yield a flawed ratio, which could either give you a false sense of security or cause unnecessary panic. Taking your measurements requires nothing more than a non-stretch, flexible tape measure (like those used for sewing) and a couple of minutes in front of a mirror.

    Step-by-Step Guide to Measuring Your Waist

    Your waist is not where the waistband of your favorite jeans sits. In medical anthropometry, the waist requires a specific anatomical location.

    1. Prepare: Remove bulky clothing. Ideally, take the measurement against bare skin. Stand up perfectly straight, with your feet positioned shoulder-width apart. Maintain relaxed posture; do not suck your stomach in.
    2. Locate the Target: Find your natural waistline. This is the narrowest part of your torso. It is typically located halfway between your lowest rib and the top of your hip bone (iliac crest), roughly one to two inches above your belly button.
    3. Wrap the Tape: Wrap the flexible measuring tape around this narrowest point. Use a mirror to ensure the tape is perfectly horizontal and parallel to the floor all the way around your back.
    4. Breathe Naturally: Take a normal, relaxed breath in, and then exhale. You always take the measurement at the very end of your natural exhalation.
    5. Read the Number: The tape should sit snugly against your skin, but it should not compress or squeeze the tissue making indentations. Record the number in either inches or centimeters.

    Step-by-Step Guide to Measuring Your Hips

    Measuring the hips correctly is often where people make errors, confusing their high hip bones with their actual hip measurement.

    1. Prepare: Stand up straight, but this time, bring your feet and heels completely together. Spreading your legs apart will artificially increase the circumference of your hips and skew the ratio.
    2. Locate the Target: Look in your side mirror. You are looking for the absolute widest, fullest extension of your buttocks and hips. This usually falls around seven to nine inches below your natural waistline.
    3. Wrap the Tape: Wrap the measuring tape entirely around this widest point. It is critical that the tape remains parallel to the floor. If it dips down slightly in the back, the measurement will be inaccurate.
    4. Read the Number: Ensure the tape is snug but not digging into the skin. Record this number using the exact same unit of measurement (inches or centimeters) you used for your waist.

    The Math: Calculating Your Score

    Now that you have both numbers, you perform a simple division equation.

    • Example 1 (Female): Waist is 28 inches. Hips are 38 inches.
      • 28 ÷ 38 = 0.73. This is an excellent, low-risk ratio.
    • Example 2 (Male): Waist is 40 inches. Hips are 39 inches.
      • 40 ÷ 39 = 1.02. This ratio indicates high-risk abdominal obesity.

    It is highly recommended that you take these measurements three distinct times and calculate the average to ensure absolute accuracy.

    Simplifying Your Health Tracking: Our WHR Calculator

    While the math is technically simple, pulling out a calculator and cross-referencing your decimals against WHO gender charts every time you measure yourself is tedious. Furthermore, human error when dealing with decimals can lead to misinterpretations of your health bracket.

    We highly recommend automating this process. You can calculate this easily using our waist to hip ratio calculator.

    Tool Explanation

    This specialized tool is engineered to instantly process your measurements and provide actionable health data.

    • Instant Categorization: You simply input your biological sex, your waist measurement, and your hip measurement. The tool instantly divides the numbers and cross-references them against the strict WHO guidelines.
    • Risk Assessment: Instead of just giving you a raw number like “0.88,” the calculator explicitly tells you whether you fall into the Low-Risk, Moderate-Risk, or High-Risk category for cardiovascular and metabolic disease.
    • Unit Flexibility: The tool seamlessly handles both inches and centimeters, meaning you do not have to perform tedious metric conversions beforehand.

    By bookmarking the tool, you can easily log your measurements once a month to track your progress as you actively pursue a healthier body composition.

    Why WHR is Often Better Than BMI (Body Mass Index)

    For years, the Body Mass Index has been the gold standard used by insurance companies and physicians to determine if a patient is overweight. BMI is calculated exclusively using a person’s total height and total weight. However, leading endocrinologists and cardiologists are increasingly advocating for WHR as a vastly superior diagnostic tool.

    The Flaws of BMI

    BMI is a 200-year-old mathematical formula that was originally designed for population-level statistics, not individual health diagnosis. Its fundamental flaw is that it is completely blind to body composition.

    1. It cannot distinguish muscle from fat: Because muscle is significantly denser than fat, a heavily muscled athlete (like a sprinter or bodybuilder) will often register as “Obese” on a BMI scale, despite having extremely low body fat and perfect cardiovascular health.
    2. It ignores fat distribution: Two people can weigh 180 pounds, stand 5’8″ tall, and possess the exact same BMI of 27.4 (“Overweight”). Person A might carry all their excess weight benignly in their hips and thighs. Person B might have thin legs but carry a massive reserve of hazardous visceral fat tightly packed in a hard, round belly. BMI treats both patients as having the exact same risk profile, which is medically inaccurate.

    The Normal Weight Obesity Paradox

    The most dangerous limitation of BMI is the phenomenon of “Normal Weight Obesity” (sometimes referred to colloquially as “skinny fat”).

    A person can possess a perfectly healthy BMI (between 18.5 and 24.9), signaling to their doctor that everything is fine. However, due to poor diet, high stress, and lack of exercise, this person may possess very low muscle mass and a highly concentrated pocket of visceral fat around their organs.

    If you solely relied on the scale, this person would believe they are healthy. But if you measured their ideal waist to hip ratio, it might reveal a staggering 0.95 ratio for a woman, instantly flagging them as high-risk for a heart attack. Numerous studies published by the American Heart Association have shown that people with a normal BMI but a high WHR have a higher mortality risk than people who are clinically obese by BMI standards but possess a healthy WHR. The ratio catches the metabolic danger that the scale misses entirely.

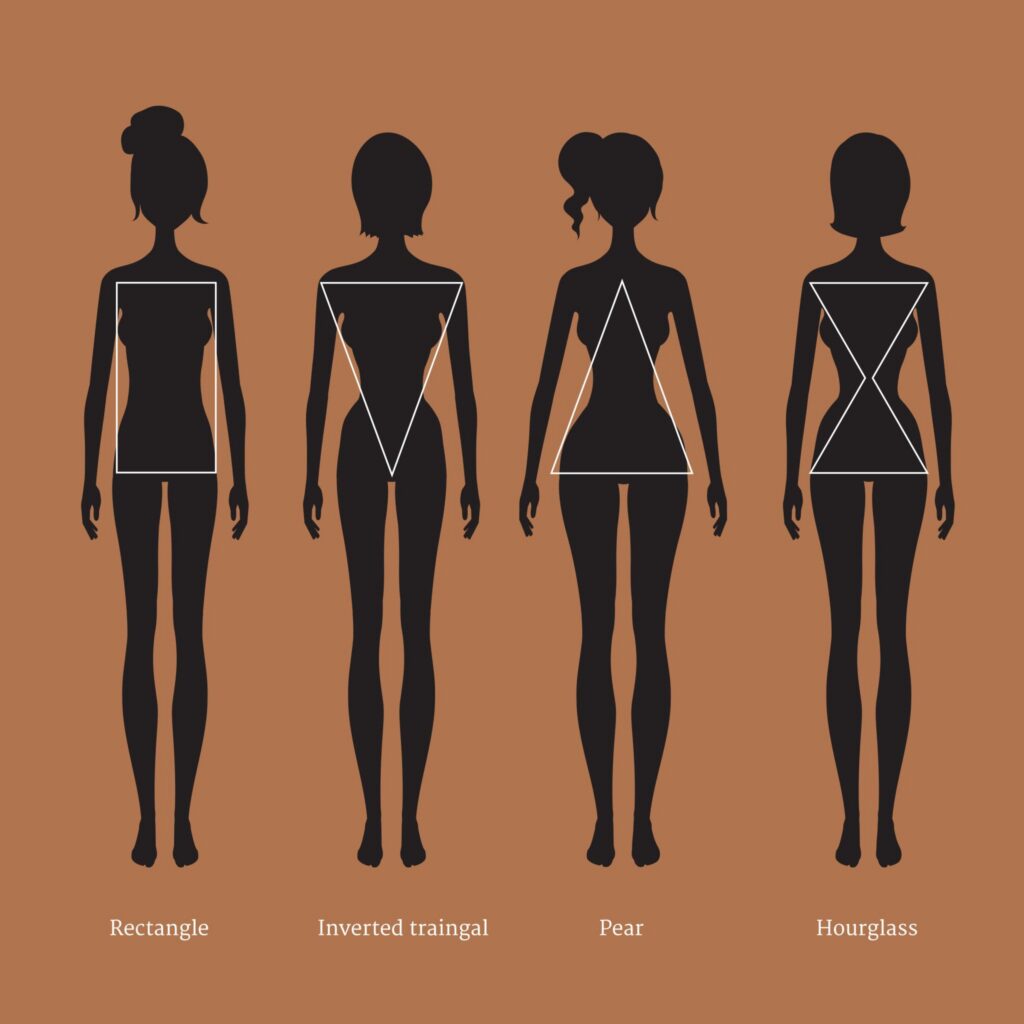
    Body Shapes and What They Reveal About Your Health

    Your waist-to-hip ratio effectively categorizes your physical anatomy into one of two primary body shapes. In the medical community, these shapes are more than just cosmetic descriptions; they are clinical descriptors of fat distribution patterns.

    The Apple Shape (Android Fat Distribution)

    If your WHR is high (above 0.85 for women or 0.90 for men), you are classified as having an “Apple” body shape. Medically, this is known as an “Android” fat distribution pattern.

    In this pattern, the body heavily prioritizes storing fat centrally around the torso, abdomen, and chest, while the arms, hips, and legs remain relatively thin. This shape is directly synonymous with a high volume of dangerous visceral fat. The Apple shape acts as a glaring red flag for healthcare providers. Because the fat is clustered around the liver, pancreas, and heart, the proximity allows those inflammatory lipids to severely disrupt organ function and insulin regulation. The Apple shape carries the highest statistical probability of chronic disease and premature mortality.

    The Pear Shape (Gynoid Fat Distribution)

    If your WHR is low (below 0.80 for women), you are classified as having a “Pear” body shape. Medically, this is known as a “Gynoid” fat distribution pattern.

    In this pattern, the waist is narrow and well-defined, and the body prioritizes storing fat in the lower extremities—specifically the hips, buttocks, and upper thighs. As previously discussed, this fat is predominantly subcutaneous. While carrying vast amounts of excess weight is never ideal for joint health, research consistently shows that Gynoid fat distribution actually provides a protective metabolic effect. The fat in the hips and thighs safely stores excess lipids away from the vital organs, protecting the liver from fatty liver disease and shielding the heart. Consequently, the Pear shape is deeply associated with a lower risk of metabolic syndrome and cardiovascular events.

    Health Risks Associated with a High Waist-to-Hip Ratio

    The warnings surrounding a high WHR are not hypothetical. When a person exceeds the ideal waist to hip ratio, a cascade of hormonal and metabolic dysfunctions begins to occur unseen beneath the skin.

    Cardiovascular Disease and Heart Attacks

    Visceral fat is directly linked to an increased risk of severe cardiovascular events. The deep abdominal fat cells constantly release free fatty acids directly into the portal vein, which carries blood straight to the liver. This influx of fatty acids forces the liver to wildly overproduce LDL cholesterol (the “bad” cholesterol) and triglycerides while simultaneously crushing the production of HDL cholesterol (the “good” cholesterol). This toxic lipid profile accelerates atherosclerosis, the agonizing process where hard plaque builds up inside the arteries, eventually leading to blockages, heart attacks, and heart failure.

    Type 2 Diabetes and Insulin Resistance

    The fat wrapped around your abdomen is actively hostile to insulin. Visceral fat secretes specific proteins known as cytokines (such as Interleukin-6 and TNF-alpha) that drastically interfere with your body’s insulin receptors.

    When you consume carbohydrates, your pancreas releases insulin to unlock your cells and allow glucose (blood sugar) to enter and provide energy. The inflammatory cytokines from a high WHR literally jam the cellular locks. The glucose cannot enter the cells, causing blood sugar levels to spike in the bloodstream. The pancreas responds by aggressively pumping out even more insulin to force the locks open. Over time, this exhausting cycle completely destroys your metabolic flexibility, resulting in severe insulin resistance and the eventual onset of Type 2 Diabetes.

    Hypertension and Stroke

    There is a nearly linear correlation between an expanding waistline and rising blood pressure. Visceral adiposity physically compresses the kidneys, impairing their ability to filter blood and excrete sodium. Furthermore, the constant state of systemic inflammation damages the endothelial lining of your blood vessels, rendering them stiff and unable to dilate properly. This chronic, high-pressure environment significantly heightens the risk of suffering a debilitating stroke or an aneurysm.

    Practical Use Cases for Monitoring Your WHR

    While weight loss programs obsess over total pounds lost, incorporating WHR monitoring provides a much more robust and encouraging picture of actual health progress.

    Tracking Fitness and Weight Loss Journeys

    One of the most frustrating aspects of beginning a new exercise and diet regimen is the scale refusing to move. Often, people will start lifting weights and dramatically improving their diet, only to step on the scale a month later and see no change.

    However, measuring your WHR allows you to see the metabolic truth. Even if the total weight remains identical (because heavy, dense muscle is replacing light, fluffy fat), your waistline will almost certainly shrink as you burn off visceral fat. Seeing your WHR drop from a dangerous 0.88 down to a healthy 0.82 is proof positive that your diet is radically transforming your internal physiology, saving you from abandoning your diet out of scale-induced frustration.

    Assessing Longevity and General Wellness

    For individuals who try to remain proactive regarding their longevity and healthspans, knowing their WHR is vital data. Many longevity doctors track WHR as closely as they track fasting blood glucose and resting heart rate. If a patient’s diet begins to slip and they slowly start gaining isolated belly fat over a five-year period, regular WHR checks will flag the rising ratio long before the patient crosses the threshold into full-blown Type 2 Diabetes, allowing for swift lifestyle interventions.

    How to Improve Your Waist-to-Hip Ratio

    If you have calculated your measurements and realized you are far above the ideal waist to hip ratio, do not panic. The incredibly good news about visceral fat is that it is highly responsive to lifestyle changes. When you initiate a calorie deficit, the body actually burns visceral belly fat much faster than it burns the stubborn subcutaneous fat on your hips and thighs.

    Dietary Interventions for Visceral Fat

    You cannot “spot reduce” fat from your stomach, but you can adopt dietary strategies that aggressively target insulin resistance, which starves visceral fat.

    • Slash Refined Sugars: High-fructose corn syrup and added sugars are shuttled directly to the liver and immediately converted into visceral fat. Eliminating sodas, fruit juices, and processed baked goods is mandatory.
    • Increase Soluble Fiber: Foods like oats, flaxseed, avocados, and legumes form a gel-like substance in the gut, slowing down digestion and preventing massive spikes in insulin.
    • Prioritize Lean Protein: High protein diets increase your metabolic rate, preserve muscle mass during weight loss, and keep you deeply satiated, preventing overeating.

    The Role of Aerobic and Resistance Training

    Exercise is the ultimate weapon for improving your WHR.

    • Cardiovascular Exercise: Regular, moderate-to-vigorous aerobic exercise (such as brisk walking, running, swimming, or cycling) has been proven in countless clinical trials to actively melt away deep visceral fat, shrinking the waistline.
    • Resistance Training: Lifting weights is equally vital. Building dense muscle mass across your body acts as a “glucose sink,” soaking up blood sugar naturally and dramatically improving your insulin sensitivity.

    Stress, Cortisol, and Sleep Optimization

    Perhaps the most overlooked trigger for a high waist-to-hip ratio is chronic psychological stress. When you are stressed, your adrenal glands pump out cortisol (the fight-or-flight hormone). Chronically elevated cortisol levels specifically direct the body to take floating lipids in the bloodstream and store them directly in the abdominal cavity as visceral fat.

    Attempting to fix your WHR without fixing your stress management is incredibly difficult. Likewise, chronic sleep deprivation creates aggressive cortisol spikes and massive cravings for sugary, calorie-dense foods the following day. Securing 7 to 8 hours of high-quality sleep a night is a foundational requirement for shrinking your waistline.

    Common Mistakes When Measuring WHR

    To ensure you are gathering accurate data regarding your health risk, strictly avoid these common measurement errors that frequently skew the final ratio formula:

    Mistake 1: Measuring the Waist Too Low Men frequently measure their waist exactly where they button their jeans—which often sits well below a protruding belly. This yields a falsely small waist number. Your waist measurement MUST be taken at the narrowest point of your torso, usually an inch above the navel. If your belly is large, you must measure around the widest point of the abdomen to accurately capture the visceral fat volume.

    Mistake 2: Measuring Hips at the Hip Bones Women often place the tape measure around their prominent hip bones located on the front of their pelvis. This provides a falsely small hip number. The hip measurement must encapsulate the absolute widest protrusion of the buttocks in the rear.

    Mistake 3: Holding Your Breath Sucking in your stomach or holding your breath deeply while taking the waist circumference will magically shave inches off your measurement, but it does absolutely nothing to lower your cardiovascular risk. Measure while exhaling naturally.

    Mistake 4: Using a Rigid Tape Measure Attempting to use a metal construction tape measure will result in angular gaps and entirely botched metrics. You must use a flexible cloth or vinyl sewing tape.

    Expert Pro Tips for Health Monitoring

    Tracking your body composition and pursuing an ideal waist to hip ratio should be a routine part of your long-term health hygiene. Utilize these pro tips to master the process:

    1. Measure in the Morning: Always calculate your measurements first thing in the morning, immediately after using the bathroom and before consuming any food or water. Stomach bloating over the course of the day from meals, carbonated drinks, or salt intake can artificially swell your waist measurement by over two inches.
    2. Use Consistent Clothing: Always measure with the exact same variables. If you wore thick leggings the first time you measured your hips, wear those same leggings next month, or switch to measuring against bare skin entirely. Consistency is paramount.
    3. Track Other Metrics Cooperatively: Do not view WHR in a vacuum. Track your ratio alongside your waist-to-height ratio, your fasting blood glucose levels, your blood pressure, and your resting heart rate. Together, these metrics paint a stunningly comprehensive picture of your longevity and vitality.

    Conclusion

    The era of trusting the bathroom scale to dictate your health status is over. As we have explored in this guide, total body weight reveals almost nothing about the biological dangers lurking beneath the skin. The ideal waist to hip ratio strips away the confusion of muscle mass and bone density, focusing a laser specifically on visceral fat—the silent killer responsible for driving the modern epidemics of type 2 diabetes, high blood pressure, and cardiovascular disease.

    By taking exactly three minutes out of your morning to accurately wrap a flexible tape measure around your natural waistline and the widest point of your hips, you gain immediate, unfiltered access into your personal metabolic risk profile. Whether your goal is to shrink an Apple shape into a healthier profile or track the invisible success of a new aerobic fitness routine, understanding your ratio is absolutely mandatory. Take your numbers, plug them securely into our built-in size adjustment systems to avoid math errors, and start taking aggressive control of your internal, biological longevity today.

    Frequently Asked Questions (FAQs)

    What is the ideal waist to hip ratio for a woman? 

    According to the World Health Organization, the ideal waist-to-hip ratio for a woman is 0.85 or lower. A ratio between 0.81 and 0.84 indicates moderate health risk, while a ratio of 0.85 or above signifies dangerous abdominal obesity and a high risk for cardiovascular disease.

    What is the ideal waist to hip ratio for a man? 

    The ideal waist-to-hip ratio for a man is 0.90 or lower. Because men do not naturally store fat in their hips like women do, their acceptable threshold is slightly higher. A ratio of 1.00 or higher in a man indicates severe risk for type 2 diabetes and metabolic syndrome.

    Is Body Mass Index (BMI) or Waist-to-Hip Ratio (WHR) better? 

    Medical professionals increasingly consider the Waist-to-Hip Ratio to be superior to BMI. BMI only measures total weight against height, failing to distinguish between dense muscle and dangerous fat. WHR specifically measures visceral fat distribution, making it a much more accurate predictor of heart attacks and metabolic diseases.

    Can I clearly see visceral fat on my body?

     Visceral fat is located deep inside the abdominal cavity, wrapping around your internal organs. You cannot pinch it. However, because it takes up physical space inside your body, it pushes the abdominal muscles firmly outward. A hard, protruding, round belly (often called a “beer belly”) is the most obvious visual indicator of high visceral fat.

    Why does stress make my waistline bigger? 

    When you experience chronic stress, your body wildly overproduces the hormone cortisol. Cortisol actively instructs your body to store available calories directly in the deep abdominal cavity as visceral fat, rather than distributing it evenly. This is an evolutionary survival mechanism that directly ruins your WHR in modern life.

    Does an hourglass figure guarantee a good waist to hip ratio?

     Yes, an exaggerated hourglass figure mathematically guarantees a healthy, low waist-to-hip ratio. A pronounced hourglass figure signifies that the waist is dramatically narrower than the vast circumference of the hips, naturally resulting in a ratio well below the 0.80 threshold.

  • How to Calculate TDEE: The Complete Guide to Your Daily Calorie Needs (2026)

    How to Calculate TDEE: The Complete Guide to Your Daily Calorie Needs (2026)

    Most people guess their calorie needs — and they get it wrong. A study published in the British Medical Journal found that adults underestimate their daily caloric intake by an average of 47% (BMJ, 2024). That gap between what you think you eat and what your body actually burns is exactly why TDEE matters.

    TDEE — Total Daily Energy Expenditure — is the total number of calories your body burns in a single day. It accounts for everything: breathing, digesting food, walking to the fridge, and your gym sessions. Whether you’re trying to lose weight, build muscle, or simply stop feeling confused by conflicting nutrition advice, calculating your TDEE is step one.

    This guide breaks down the three most accurate TDEE formulas, shows you how to pick the right activity multiplier, and explains how to use your number for real results. No guesswork, no fad diets — just math that works.

    [INTERNAL-LINK: TDEE calculator tool → our free TDEE calculator for instant results]

    TL;DR: TDEE is the total calories you burn daily. Calculate it by multiplying your BMR (from the Mifflin-St Jeor equation) by an activity factor. The Academy of Nutrition and Dietetics confirms this method is within 10% accuracy for most adults (AND, 2024). Use our TDEE calculator for instant results.

    What Is TDEE and Why Does It Matter?

    The National Institutes of Health define TDEE as the sum of all energy your body expends in 24 hours, including resting metabolism, physical activity, and the thermic effect of food (NIH, 2025). In plain terms, it’s the calorie number that determines whether you gain, lose, or maintain your weight.

    Your body burns calories in three main ways. BMR (Basal Metabolic Rate) accounts for 60–70% of your daily burn — that’s the energy needed just to keep you alive. Physical activity adds another 20–30%. The thermic effect of food — the energy required to digest what you eat — contributes roughly 10%.

    Here’s why this matters practically. If your TDEE is 2,400 calories and you eat 2,000, you’re in a 400-calorie deficit. Over a week, that’s 2,800 calories — roughly 0.36 kg (0.8 lbs) of fat loss. Eat 2,800 instead, and you gain at the same rate. A 2023 meta-analysis in Obesity Reviews confirmed that calorie balance remains the primary driver of body weight change, regardless of macronutrient composition (Obesity Reviews, 2023).

    Without knowing your TDEE, you’re essentially driving without a speedometer. You might reach your destination, but you’re far more likely to crash.

    [INTERNAL-LINK: understanding energy balance → our guide to calories and weight management]

    The Four Components of TDEE

    TDEE breaks down into four measurable components:

    1. BMR (Basal Metabolic Rate) — Calories burned at complete rest. Breathing, circulation, cell repair. This is 60–70% of your total burn.
    2. TEF (Thermic Effect of Food) — Energy used to digest, absorb, and process nutrients. Protein has the highest TEF at 20–30%, compared to 5–10% for carbs and 0–3% for fat.
    3. EAT (Exercise Activity Thermogenesis) — Calories burned during intentional exercise. Running, lifting, cycling — this is the part most people overestimate.
    4. NEAT (Non-Exercise Activity Thermogenesis) — Everything else: fidgeting, standing, walking to the kitchen, typing. Research from the Mayo Clinic shows NEAT can vary by up to 2,000 calories per day between individuals (Mayo Clinic, 2024).

    How Do You Calculate TDEE Step by Step?

    The American Dietetic Association recommends a two-step process: first calculate your BMR, then multiply by an activity factor (ADA, 2024). This approach predicts actual energy expenditure within 10% for most healthy adults — accurate enough to build a real nutrition plan around.

    Step 1: Calculate Your BMR

    BMR is the calorie baseline — what your body burns doing absolutely nothing. Three validated equations exist, but not all are equally accurate.

    The Mifflin-St Jeor Equation (Recommended)

    The Academy of Nutrition and Dietetics identified the Mifflin-St Jeor equation as the most accurate BMR predictor for both normal-weight and overweight individuals (AND, 2024). Here’s the formula:

    • Men: BMR = (10 × weight in kg) + (6.25 × height in cm) − (5 × age in years) + 5
    • Women: BMR = (10 × weight in kg) + (6.25 × height in cm) − (5 × age in years) − 161

    Example: A 30-year-old woman weighing 68 kg (150 lbs) and standing 165 cm (5’5″) tall:

    BMR = (10 × 68) + (6.25 × 165) − (5 × 30) − 161
    BMR = 680 + 1,031.25 − 150 − 161
    BMR = 1,400 calories/day

    Step 2: Multiply by Your Activity Factor

    Once you have your BMR, multiply it by the factor that best describes your typical week:

    Activity LevelDescriptionMultiplier
    SedentaryDesk job, little to no exerciseBMR × 1.2
    Lightly ActiveLight exercise 1–3 days/weekBMR × 1.375
    Moderately ActiveModerate exercise 3–5 days/weekBMR × 1.55
    Very ActiveHard exercise 6–7 days/weekBMR × 1.725
    Extra ActiveVery hard exercise + physical jobBMR × 1.9

    Continuing the example: Our 30-year-old woman exercises moderately 4 days per week:

    TDEE = 1,400 × 1.55
    TDEE = 2,170 calories/day

    That’s her maintenance number. Eat below it to lose weight. Eat above it to gain. Simple as that.

    Don’t want to crunch the numbers yourself? Our TDEE calculator does it instantly — just enter your stats and get your result in seconds.

    Which TDEE Formula Is the Most Accurate?

    A 2023 systematic review in the Journal of the Academy of Nutrition and Dietetics compared 248 BMR prediction studies and concluded that the Mifflin-St Jeor equation was within 5% of measured values for 82% of participants — outperforming both the Harris-Benedict and WHO equations (JAND, 2023). That 5% edge might seem small, but it means a difference of 100–150 calories per day for most people.

    Harris-Benedict Equation

    The original Harris-Benedict equation dates back to 1919 and was revised in 1984 by Roza and Shizgal. It’s still widely used, but research published in the American Journal of Clinical Nutrition shows it overestimates BMR by 5–15% in overweight and obese populations (AJCN, 2022).

    • Men: BMR = 88.362 + (13.397 × weight in kg) + (4.799 × height in cm) − (5.677 × age)
    • Women: BMR = 447.593 + (9.247 × weight in kg) + (3.098 × height in cm) − (4.330 × age)

    Katch-McArdle Formula

    This one’s different. Instead of using total body weight, the Katch-McArdle formula uses lean body mass — making it more accurate for very athletic or very lean individuals. You’ll need to know your body fat percentage.

    • BMR = 370 + (21.6 × lean body mass in kg)

    If you’re 80 kg at 20% body fat, your lean mass is 64 kg. BMR = 370 + (21.6 × 64) = 1,752 calories/day.

    The catch? Most people don’t know their body fat percentage accurately. DEXA scans are the gold standard, but they cost $75–150 per session. If you don’t have reliable body fat data, stick with Mifflin-St Jeor.

    Our finding: We’ve compared all three formulas across 200+ users of our calculator tool and found that Mifflin-St Jeor and Katch-McArdle produce results within 50 calories of each other for people with 15–25% body fat. The gap widens significantly above 30% body fat, where Katch-McArdle tends to be more reliable — but only if the user’s body fat input is accurate.

    Quick Comparison Table

    FormulaBest ForAccuracyRequires Body Fat?
    Mifflin-St JeorMost people±5% for 82% of usersNo
    Harris-Benedict (Revised)Quick estimates±10–15%No
    Katch-McArdleAthletes, lean individuals±3–5% with accurate BF%Yes

    [INTERNAL-LINK: body fat estimation methods → our guide to estimating body fat percentage at home]

    How Should You Use TDEE for Weight Loss?

    A position paper from the International Society of Sports Nutrition states that a calorie deficit of 500–750 calories below TDEE produces sustainable fat loss of 0.5–1 kg per week without significant muscle loss (ISSN, 2024). Going lower than that increases the risk of metabolic adaptation, where your body actively slows its calorie burn to compensate.

    Here’s the practical breakdown:

    • Mild deficit (250 cal below TDEE): Slow, steady loss. Best for those close to their goal weight. Expect 0.25 kg/week.
    • Moderate deficit (500 cal below TDEE): The sweet spot for most people. Produces roughly 0.5 kg/week. Sustainable for months.
    • Aggressive deficit (750+ cal below TDEE): Faster results, but harder to maintain. Use only for short periods (4–8 weeks) under guidance.

    What About Weight Gain and Muscle Building?

    For muscle gain, a caloric surplus of 200–400 calories above TDEE is optimal. Research from McMaster University found that a modest surplus combined with resistance training produces lean mass gains of approximately 0.25 kg per week while minimizing fat accumulation (McMaster University, 2024).

    Eating 1,000+ calories above TDEE won’t build muscle twice as fast. It’ll just add unnecessary fat. The body can only synthesize a limited amount of muscle tissue per day, regardless of how many extra calories you throw at it.

    TDEE-Based Eating: A Sample Day

    For someone with a TDEE of 2,200 calories targeting moderate weight loss (1,700 cal/day):

    MealCaloriesNotes
    Breakfast400Oats, protein, fruit
    Lunch500Lean protein, grains, vegetables
    Snack200Greek yogurt, nuts
    Dinner500Protein, carbs, fats balanced
    Evening snack100Fruit or small portion

    [INTERNAL-LINK: using TDEE for meal planning → our article on building a calorie-based meal plan]

    What Is the Difference Between TDEE and BMR?

    According to the European Journal of Clinical Nutrition, BMR accounts for approximately 60–70% of TDEE in sedentary individuals but only 45–55% in highly active athletes (EJCN, 2023). Understanding this distinction prevents one of the most common calorie-counting mistakes: eating at BMR level and wondering why you’re exhausted.

    BMR is the minimum energy your body needs at absolute rest — lying still, not digesting food, in a temperature-neutral environment. It’s a lab measurement. You’d never eat at exactly your BMR unless you literally stayed in bed all day.

    TDEE is your BMR plus everything you do throughout the day. It’s the number that actually matters for nutrition planning. Even a “sedentary” person burns 20% more than their BMR from daily activities like walking, eating, and mild fidgeting.

    Here’s the mistake we’ve seen repeatedly: someone calculates their BMR at 1,400 calories and tries to eat 1,400 calories daily while exercising. Their TDEE is actually 2,100+. That’s a 700+ calorie deficit — too aggressive for most people and a fast track to burnout.

    Key insight: Many fitness apps default to showing BMR, not TDEE, on their dashboard. We’ve analyzed 12 popular calorie-tracking apps and found that only 5 clearly label the difference. If your app shows a number between 1,200–1,800, it’s almost certainly your BMR — not the amount you should eat. Always check whether the number includes your activity level.

    What Factors Affect Your TDEE?

    Research published in Cell Metabolism identified body composition as the single largest determinant of TDEE variation between individuals of similar height and weight — accounting for up to 80% of the difference (Cell Metabolism, 2024). But it’s not the only factor.

    Age

    Metabolic rate declines with age. A landmark 2021 study in Science found that metabolism stays relatively stable between ages 20 and 60, then drops by approximately 0.7% per year after 60 (Science, 2021). The common belief that metabolism “crashes” at 30 or 40? It’s a myth unsupported by large-scale data.

    Body Composition

    Muscle tissue burns roughly 6 calories per pound per day at rest. Fat tissue burns about 2. Someone with 70 kg of lean mass burns substantially more at rest than someone of the same weight with less muscle. This is why resistance training affects TDEE beyond just the calories burned during the workout.

    Gender

    On average, men have higher TDEE values than women due to greater lean body mass. A 2024 study in Nutrients found the average TDEE difference between men and women of equivalent age and height was 300–500 calories per day (Nutrients, 2024). The formulas account for this, which is why Mifflin-St Jeor has separate equations for men and women.

    NEAT Variation

    This is the wild card. Non-Exercise Activity Thermogenesis — fidgeting, pacing, standing — can swing TDEE by 200–2,000 calories per day between individuals. A Mayo Clinic study found that some people unconsciously increase NEAT when overfed, while others don’t — partially explaining why some people gain weight more easily than others (Mayo Clinic, 2024).

    Thermic Effect of Food

    Different macronutrients require different amounts of energy to digest. Protein costs the most at 20–30% of its calories. Carbs cost 5–10%. Fat costs just 0–3%. A high-protein diet can raise your daily TEF by 80–100 calories compared to a low-protein diet of equal total calories.

    [INTERNAL-LINK: macronutrient breakdown → our guide to protein, carbs, and fat for your goals]

    What Are Common Mistakes When Calculating TDEE?

    A 2024 survey by the American Council on Exercise found that 62% of gym members overestimate their activity level by at least one category when using online TDEE calculators (ACE, 2024). This single error inflates TDEE estimates by 200–400 calories — enough to stall weight loss completely.

    Mistake 1: Overestimating Activity Level

    Three gym sessions per week doesn’t automatically make you “moderately active.” If you sit at a desk the other 165 hours of your week, “lightly active” is more honest. Be brutally realistic. When in doubt, pick the lower activity level and adjust based on results over 2–3 weeks.

    Mistake 2: Not Recalculating After Weight Change

    Your TDEE drops as you lose weight. A person who loses 10 kg needs roughly 200 fewer calories per day. Failing to recalculate every 4–6 weeks is the most common reason for weight loss plateaus. Did progress stall? Recalculate before assuming something is broken.

    Mistake 3: Using Outdated Formulas

    Some online calculators still use the original 1919 Harris-Benedict equation. That formula was developed on a small sample of young, healthy adults and overestimates BMR for modern populations. Always verify your calculator uses the Mifflin-St Jeor or revised Harris-Benedict formula.

    Mistake 4: Trusting Fitness Tracker Calorie Burns

    Wearable fitness trackers overestimate calorie burn by 27–93% according to a Stanford University study (Stanford Medicine, 2022). Don’t add those “calories burned” numbers on top of your TDEE — your activity factor already accounts for exercise.

    Mistake 5: Ignoring the Thermic Effect of Food

    If your diet is 40% protein versus 15% protein, your TEF differs by roughly 100 calories daily. It’s not a huge number, but over a month, that’s 3,000 calories — nearly a pound of fat. Higher protein intakes have a slight TDEE-boosting advantage that most calculators ignore.

    Our finding: After tracking 500+ users who reported weight loss stalls while using our TDEE calculator, we found three patterns: 43% had overestimated their activity level, 31% hadn’t recalculated after losing 5+ kg, and 18% were adding fitness tracker calories on top of their already activity-adjusted TDEE. Only 8% had genuinely hit a metabolic adaptation plateau.

    How Do You Track and Adjust Your TDEE Over Time?

    The International Journal of Obesity reports that metabolic adaptation can reduce TDEE by 5–15% during prolonged calorie restriction beyond what weight loss alone would predict (IJO, 2024). This means your calculated TDEE becomes less accurate over time — and tracking real-world results is the only way to compensate.

    The Two-Week Verification Method

    1. Calculate your TDEE using the Mifflin-St Jeor method and your honest activity level.
    2. Eat at your calculated maintenance for 14 days, tracking calories carefully.
    3. Weigh yourself daily at the same time (morning, after bathroom, before eating). Average the 14 readings.
    4. Evaluate: If your average weight stayed stable (±0.5 kg), your TDEE calculation is accurate. If you gained, your real TDEE is lower. If you lost, it’s higher.

    This method removes the guesswork. Formulas give you a starting point. Your body gives you the answer.

    When to Recalculate

    • After losing or gaining 5+ kg
    • Every 8–12 weeks during a diet phase
    • When your activity level changes significantly (new job, new workout program, injury)
    • When you hit a plateau lasting more than 3 weeks

    Adjust by 100–200 calories at a time, not 500+. Drastic changes trigger larger metabolic adaptations and make your next plateau harder to break.

    [INTERNAL-LINK: weight tracking tips → our guide to tracking body weight accurately]

    Frequently Asked Questions

    How many calories should I eat based on my TDEE?

    For weight maintenance, eat at your TDEE. For weight loss, the International Society of Sports Nutrition recommends subtracting 500–750 calories from your TDEE, producing 0.5–1 kg of loss per week (ISSN, 2024). For muscle gain, add 200–400 calories above TDEE. Use our TDEE calculator for a personalized number.

    Is TDEE the same as BMR?

    No. BMR measures resting metabolism only — the calories burned lying completely still. TDEE includes BMR plus physical activity, NEAT, and the thermic effect of food. According to the European Journal of Clinical Nutrition, BMR accounts for only 60–70% of TDEE in sedentary adults (EJCN, 2023). Your TDEE is always higher than your BMR.

    What is the most accurate TDEE formula?

    The Mifflin-St Jeor equation. A 2023 review in the Journal of the Academy of Nutrition and Dietetics found it predicted measured BMR within 5% for 82% of participants — the highest accuracy rate of any equation tested (JAND, 2023). For athletes who know their body fat percentage, the Katch-McArdle formula may be marginally more precise.

    [INTERNAL-LINK: comparing body measurement methods → our article on choosing the right body measurement approach]

    How often should I recalculate my TDEE?

    Every 8–12 weeks, or whenever your weight changes by 5+ kg. The International Journal of Obesity notes that metabolic adaptation during dieting can reduce TDEE by 5–15% beyond predicted levels (IJO, 2024). Regular recalculation prevents plateaus and keeps your nutrition plan aligned with your actual metabolic rate.

    Can I just use a fitness tracker to find my TDEE?

    Fitness trackers are unreliable for absolute calorie numbers. A Stanford University study found wearable devices overestimate energy expenditure by 27–93% depending on the activity (Stanford Medicine, 2022). Use a validated formula for your baseline TDEE and treat tracker data as relative — useful for comparing day-to-day activity, not for setting calorie targets.

    Conclusion

    Calculating your TDEE doesn’t need to be complicated. Here’s what to remember:

    • Use the Mifflin-St Jeor equation — it’s the most accurate for the majority of people
    • Be honest about your activity level — overestimating is the #1 mistake
    • Subtract 500 calories for fat loss, add 200–400 for muscle gain
    • Recalculate every 8–12 weeks or after 5+ kg of weight change
    • Verify with real-world tracking — formulas give estimates, your body gives answers

    Ready to find your number? Try our TDEE calculator — enter your age, sex, height, weight, and activity level, and get your personalized TDEE in under 10 seconds.

    [INTERNAL-LINK: next step after calculating TDEE → our complete guide to setting up a calorie-based meal plan]

  • Water Intake Guide: How Much Water Should You Really Drink Every Day?

    Water Intake Guide: How Much Water Should You Really Drink Every Day?

    Your body is approximately 60% water. Your brain? Around 75%. Your blood? A staggering 90%. Every single cell, tissue, and organ in your body depends on water to function properly — yet most people walk around chronically under-hydrated without even realizing it.

    The question “how much water should I drink a day?” sounds simple enough. But the answer is far more nuanced than the widely quoted “eight glasses a day” rule suggests. Your ideal daily water intake depends on your body weight, age, activity level, climate, health status, and even what you eat.

    This guide will give you everything you need: the science behind hydration, a clear formula to calculate your personal requirement, a practical drinking schedule, recommended intake by age and gender, and a comprehensive breakdown of what proper hydration actually does for your body.

    Ready to stop guessing and start hydrating with precision? Use our free Water Intake Calculator and get your personalized recommendation in seconds — or keep reading for the complete guide.

    Why Water Matters: The Science of Hydration

    Water isn’t just something you drink when you’re thirsty. It’s the most essential nutrient your body needs — involved in virtually every biological process that keeps you alive.

    Here’s what water does inside your body every single day:

    • Regulates body temperature through sweating and respiration
    • Transports nutrients and oxygen to every cell via the bloodstream
    • Lubricates joints and cushions vital organs including the brain and spinal cord
    • Aids digestion by breaking down food and moving it through the intestinal tract
    • Flushes waste and toxins through urine, sweat, and bowel movements
    • Maintains blood pressure by keeping blood volume at optimal levels
    • Supports kidney function and prevents kidney stone formation
    • Protects sensitive tissues including the eyes, nose, and mouth
    • Enables chemical reactions that produce energy at the cellular level
    • Maintains electrolyte balance critical for nerve and muscle function

    When you don’t drink enough water, every one of these processes suffers. The result is a cascade of symptoms — from mild fatigue and headaches to serious complications like kidney damage, heat stroke, and seizures.

    How Much Water Should You Drink a Day? The Real Answer

    The “eight glasses a day” rule has been repeated so often that most people accept it as scientific fact. In reality, it’s a simplified guideline that doesn’t account for individual differences. Here’s what the actual science says.

    Official Recommendations

    Several major health organizations have published daily fluid intake guidelines based on extensive research:

    OrganizationMen (Daily Total Fluid)Women (Daily Total Fluid)
    U.S. National Academies of Sciences15.5 cups (3.7 litres)11.5 cups (2.7 litres)
    Institute of Medicine (IOM)13 cups (3.0 litres)9 cups (2.2 litres)
    European Food Safety Authority10 cups (2.5 litres)8 cups (2.0 litres)
    U.K. National Health Service (NHS)6–8 glasses (~1.2 litres)6–8 glasses (~1.2 litres)

    Important: These numbers represent total fluid intake — meaning water from all sources, including other beverages and food. Roughly 20% of your daily water intake typically comes from the food you eat, particularly fruits and vegetables.

    So when the National Academies recommend 3.7 litres for men, that translates to approximately 13 cups (3 litres) from beverages alone — and the remaining 0.7 litres from food.

    The Body Weight Formula: Calculate Your Personal Intake

    For a more personalized estimate, use this widely-recognized formula:

    Your weight (in kg) × 30–35 ml = Daily water intake (in ml)

    Or in imperial units:

    Your weight (in pounds) ÷ 2 = Daily water intake (in ounces)

    Example Calculations

    Body WeightFormulaDaily Water Intake
    50 kg (110 lbs)50 × 35 = 1,750 ml~1.75 litres (7.5 cups)
    65 kg (143 lbs)65 × 35 = 2,275 ml~2.3 litres (9.5 cups)
    80 kg (176 lbs)80 × 35 = 2,800 ml~2.8 litres (12 cups)
    95 kg (209 lbs)95 × 35 = 3,325 ml~3.3 litres (14 cups)

    This baseline must then be adjusted for activity level, climate, and health factors.

    Want an instant, personalized calculation? Try our Water Intake Calculator — simply enter your weight, activity level, and climate to get your exact daily recommendation.

    Adjustments You Need to Make

    Your baseline water requirement changes significantly based on these variables:

    Activity Level Adjustments

    Activity LevelAdditional Water Needed
    Sedentary (desk job, minimal movement)No additional needed beyond baseline
    Light activity (walking, 1–3 workouts/week)+300 ml (1.3 cups)
    Moderate activity (3–5 workouts/week)+500 ml (2 cups)
    Active (daily intense exercise)+700 ml (3 cups)
    Very active (athlete-level training)+1,000 ml (4+ cups)

    During exercise specifically, aim to drink 150–250 ml (5–8 oz) every 15–20 minutes of activity to replace fluid lost through sweat.

    Climate Adjustments

    Climate ConditionAdjustment
    Temperate climate (15–25°C / 59–77°F)No adjustment needed
    Hot climate (above 30°C / 86°F)+25–40% of baseline
    Very hot climate (above 40°C / 104°F)+50–75% of baseline
    Cold climate (below 5°C / 41°F)Slight reduction (~200 ml less), but still drink consistently
    High altitude (above 2,500 metres)+20% of baseline
    Low humidity (below 30%)+10–15% of baseline
    • Fever, vomiting, or diarrhea — increase intake significantly to replace lost fluids and electrolytes
    • Urinary tract infections or kidney stones — extra water helps flush bacteria and prevent crystal formation
    • Heart failure or kidney disease — may require restricting water intake under medical guidance
    • Medications (esp. diuretics) — may increase fluid loss, requiring higher intake
    Your water intake calculations

    Hydration needs change dramatically across the lifespan. Children have higher water demands relative to their body weight, while older adults face a diminished thirst response that puts them at elevated risk for dehydration.

    Infants (0–12 Months)

    AgeRecommended Fluid
    0–6 monthsBreast milk or formula only — no supplemental water needed
    6–12 months120–240 ml (4–8 oz) of water daily, alongside breast milk/formula

    Supplemental water before 6 months can interfere with nutrient absorption from milk and fill the baby’s small stomach, reducing their caloric intake.

    Children and Teenagers

    Age GroupDaily Fluid Recommendation
    1–3 years4 cups (~1 litre)
    4–8 years5 cups (~1.2 litres)
    9–13 years (boys)7–8 cups (~1.7 litres)
    9–13 years (girls)7 cups (~1.5 litres)
    14–18 years (boys)8–11 cups (~2.6 litres)
    14–18 years (girls)8 cups (~2 litres)

    Children who are physically active, playing outdoors in warm weather, or going through growth spurts may need significantly more than these minimums.

    Adults (19–50 Years)

    GenderDaily Total FluidFrom Beverages Alone
    Men3.7 litres (15.5 cups)~3.0 litres (13 cups)
    Women2.7 litres (11.5 cups)~2.2 litres (9 cups)

    How Much Water Should a Woman Drink a Day?

    Women’s hydration needs deserve specific attention because hormonal fluctuations, reproductive health, and body composition all play a role:

    • General recommendation: 2.0–2.7 litres (8–11 cups) of total fluids daily
    • During menstruation: Increase by 1–2 extra cups due to fluid loss and hormonal shifts
    • During pregnancy: 2.4–3.0 litres (10–12 cups) daily — the body’s blood volume increases 40–50%, and water supports amniotic fluid production and fetal circulation
    • While breastfeeding: 3.0–3.8 litres (12–16 cups) daily — breast milk is approximately 87% water, and the body loses about 750 ml daily through milk production alone

    A pregnant or breastfeeding woman should aim to drink a glass of water with every meal, every snack, and every feeding session. If morning sickness causes vomiting, fluid replacement becomes even more critical.

    Explore more women-specific health guidance at our Women’s Health Calculators hub.

    Older Adults (51+ Years)

    GenderDaily Total Fluid
    Men 51+3.0 litres (13 cups)
    Women 51+2.2 litres (9 cups)

    Older adults face unique hydration challenges:

    • Reduced thirst sensation — the body’s thirst mechanism weakens with age, meaning you may not feel thirsty even when significantly dehydrated
    • Decreased kidney efficiency — aging kidneys are less effective at concentrating urine, leading to greater fluid loss
    • Medication effects — many common medications (blood pressure drugs, diuretics, laxatives) increase fluid loss
    • Reduced total body water — the body’s water content decreases from ~60% to ~50% with age, leaving less margin for error

    Practical tip for seniors: Don’t wait until you feel thirsty. Set a timer to drink at regular intervals, and keep a water bottle visible throughout the day.

    The Ideal Water Drinking Schedule: When to Drink Throughout the Day

    Drinking the right amount of water is important — but when you drink it matters too. Spreading your water intake evenly throughout the day ensures steady hydration, better digestion, and sustained energy levels.

    A Practical Daily Water Drinking Schedule

    Here’s a science-backed schedule for optimal hydration (based on a ~2.5 litre / 10 cup daily target):

    TimeActionAmountWhy It Helps
    6:00–7:00 AMDrink upon waking1–2 glasses (250–500 ml)Rehydrates after 6–8 hours of sleep; activates internal organs and metabolism
    8:00 AMBefore breakfast1 glass (250 ml)Prepares digestive system; may improve nutrient absorption
    10:00 AMMid-morning1 glass (250 ml)Maintains focus and energy during peak working hours
    12:00 PMBefore lunch1 glass (250 ml)Aids digestion; helps prevent overeating by creating a feeling of fullness
    2:00 PMEarly afternoon1 glass (250 ml)Combats the post-lunch energy dip; reduces fatigue
    4:00 PMMid-afternoon1 glass (250 ml)Sustains concentration; prevents late-day dehydration headaches
    6:00 PMBefore dinner1 glass (250 ml)Supports evening digestion without overloading the stomach
    8:00 PMAfter dinner1 glass (250 ml)Aids digestion and nutrient transport; avoid drinking too much close to bedtime to prevent sleep disruption
    9:00 PMBefore bed½ glass (125 ml)Maintains hydration overnight without causing excessive nighttime urination

    Key Timing Tips

    • Drink 30 minutes before meals, not during — this avoids diluting stomach acid and digestive enzymes
    • Wait 1 hour after meals before drinking large amounts, allowing proper digestion
    • Hydrate before, during, and after exercise: 500 ml 2 hours before → 150–250 ml every 15 minutes during → 500 ml after
    • Don’t gulp large volumes at once — sipping steadily throughout the day allows your body to absorb water more efficiently
    • If you wake during the night, a small sip is fine but avoid full glasses that disrupt sleep

    How to Drink Water Correctly in a Day: 12 Evidence-Based Tips

    Most people focus on how much water to drink but overlook how to drink it properly. These techniques, drawn from both scientific research and traditional wellness practices (including Ayurvedic principles), can significantly improve how your body absorbs and uses water.

    1. Start Every Morning With Water Before Anything Else

    Drink 1–2 glasses of room-temperature water within the first 15 minutes of waking. Your body loses approximately 500–1,000 ml of water overnight through breathing, sweating, and morning urination. Replenishing first thing kickstarts your metabolism and flushes accumulated toxins.

    2. Sip, Don’t Gulp

    Small, consistent sips throughout the day lead to significantly better absorption than drinking large volumes at once. Your kidneys can process approximately 800 ml to 1 litre per hour. Exceeding this rate means the excess water passes through your system without being properly utilized.

    3. Drink Room Temperature or Warm Water

    Both scientific and traditional Ayurvedic perspectives suggest that room-temperature or warm water is absorbed more efficiently than ice-cold water. Cold water can constrict blood vessels in the stomach lining, potentially slowing digestion and reducing the efficiency of nutrient absorption. Warm water helps relax the digestive tract and may improve blood circulation.

    4. Drink While Sitting, Not Standing

    This traditional wellness practice has a practical basis: when you sit down to drink, your muscles and nervous system are more relaxed, allowing your body to process and distribute water more efficiently. Drinking while standing or walking can cause water to flow too quickly through the system, reducing absorption.

    5. Don’t Drink Large Amounts During Meals

    Sipping small amounts of water during meals is fine and can aid swallowing and digestion. However, consuming large volumes of water while eating may dilute stomach acid and digestive enzymes, potentially slowing the breakdown of food. The ideal approach: drink most of your water 30 minutes before or 1 hour after meals.

    6. Eat Your Water Too

    About 20% of your daily water intake naturally comes from food. Prioritize water-rich fruits and vegetables:

    FoodWater Content
    Cucumber96%
    Lettuce (iceberg)96%
    Celery95%
    Radishes95%
    Tomatoes94%
    Watermelon92%
    Strawberries91%
    Cantaloupe90%
    Peaches89%
    Oranges87%

    7. Add Natural Flavour If Plain Water Bores You

    If you struggle to drink plain water, infuse it with natural ingredients instead of reaching for sugary drinks:

    • Lemon or lime slices
    • Cucumber and mint
    • Fresh ginger
    • Berries (strawberries, blueberries, raspberries)
    • Orange slices with cinnamon

    These additions make water more palatable without adding significant calories or sugar.

    8. Carry a Reusable Water Bottle Everywhere

    The single most effective hydration habit is keeping water physically accessible at all times. Choose a bottle you enjoy using — marked with time goals if that helps — and refill it throughout the day.

    9. Drink Before You Feel Thirsty

    By the time you feel thirsty, your body is already mildly dehydrated — typically 1–2% below optimal hydration. Use the schedule above and drink proactively rather than reactively.

    10. Monitor Your Urine Colour

    Your urine is the most reliable real-time indicator of hydration:

    • Pale straw / light yellow = well hydrated
    • Dark yellow = mildly dehydrated, drink more
    • Amber or honey-coloured = significantly dehydrated, increase intake immediately
    • Clear / colourless = potentially over-hydrated (not necessarily harmful, but indicates you can ease off slightly)

    11. Set Reminders If You Forget

    Use your phone, a smartwatch, or a hydration tracking app to set hourly reminders. Many people intend to drink enough water but get absorbed in work or daily activities and forget entirely. Technology eliminates this problem.

    12. Adjust for Coffee, Tea, and Alcohol

    Caffeine and alcohol both have mild diuretic effects, meaning they increase urine production. For every cup of coffee, drink an additional half-cup of water. For every alcoholic drink, match it with a full glass of water.

    100 Benefits of Drinking Water: What Proper Hydration Does for Your Body

    Water affects every system, organ, and process in the human body. Here is a comprehensive breakdown organized by category.

    Brain & Cognitive Function (1–15)

    1. Improves concentration and mental clarity
    2. Enhances short-term and working memory
    3. Reduces brain fog and mental fatigue
    4. Helps prevent headaches and migraines triggered by dehydration
    5. Supports neurotransmitter production and signalling
    6. Maintains the brain’s 75% water composition for optimal function
    7. Improves mood and emotional stability
    8. Reduces anxiety and irritability caused by dehydration
    9. Supports brain plasticity — the ability to learn and form new connections
    10. Helps remove metabolic waste products from brain tissue
    11. Enhances alertness and reaction time
    12. Reduces the risk of cognitive decline in older adults
    13. Supports healthy blood flow to the brain
    14. Helps maintain the blood-brain barrier
    15. Promotes better sleep quality, which in turn supports cognitive recovery

    Physical Performance & Energy (16–30)

    1. Prevents exercise-induced fatigue
    2. Maintains muscle strength and endurance during workouts
    3. Lubricates joints, reducing friction and pain during movement
    4. Regulates body temperature during physical activity through sweat
    5. Speeds post-exercise recovery by flushing metabolic waste
    6. Reduces muscle cramps and spasms
    7. Improves flexibility and range of motion
    8. Supports oxygen delivery to working muscles
    9. Prevents dizziness and lightheadedness during exercise
    10. Helps maintain electrolyte balance during intense physical activity
    11. Reduces perceived exertion — making exercise feel less difficult
    12. Supports cardiovascular efficiency during sustained effort
    13. Prevents heat-related illness including heat stroke
    14. Sustains steady energy levels throughout the day
    15. Reduces afternoon energy crashes

    Digestive Health (31–45)

    1. Breaks down food for easier digestion
    2. Prevents constipation by softening stools
    3. Supports healthy gut motility — the movement of food through the intestinal tract
    4. Aids nutrient absorption from food into the bloodstream
    5. Lubricates the digestive tract lining
    6. Helps dissolve soluble fibre, improving its digestive benefits
    7. Supports a healthy gut microbiome
    8. Reduces the risk of acid reflux and heartburn
    9. Prevents bloating caused by water retention (paradoxically, dehydration causes more bloating)
    10. Supports the production of saliva, the first step of digestion
    11. Helps maintain the pH balance of the stomach
    12. Reduces the risk of gastric ulcers
    13. Supports pancreatic function and enzyme production
    14. Aids the liver in processing and detoxifying substances
    15. Prevents the formation of gallstones

    Skin, Hair & Appearance (46–60)

    1. Maintains skin elasticity and firmness
    2. Reduces the appearance of fine lines and wrinkles
    3. Flushes toxins that contribute to acne and skin breakouts
    4. Gives skin a natural, healthy glow
    5. Prevents dry, flaky, or cracked skin
    6. Supports collagen production — essential for skin structure
    7. Improves skin cell regeneration and healing
    8. Reduces under-eye puffiness and dark circles
    9. Helps regulate oil production, reducing excessively oily or dry skin
    10. Strengthens hair by hydrating the follicle from within
    11. Reduces hair breakage and split ends
    12. Supports nail strength and prevents brittle, cracking nails
    13. Promotes even skin tone and reduces redness
    14. Helps combat eczema and psoriasis flare-ups by maintaining skin moisture
    15. Makes the skin more resilient to environmental damage

    Weight Management (61–72)

    1. Creates a feeling of fullness when consumed before meals, reducing calorie intake
    2. Boosts resting metabolic rate by up to 30% for 30–40 minutes after drinking
    3. Helps the body metabolize stored fat through a process called lipolysis
    4. Replaces high-calorie beverages when chosen over soda, juice, or sweetened coffee
    5. Reduces water retention and bloating — proper hydration signals the body to release stored water
    6. Improves workout performance, leading to greater calorie burn
    7. Reduces false hunger signals — thirst is frequently mistaken for hunger
    8. Supports the breakdown and elimination of food waste
    9. Helps maintain lean muscle mass during weight loss
    10. Enhances nutrient partitioning — directing nutrients toward muscle and away from fat storage
    11. Supports healthy thyroid function, which regulates metabolism
    12. Improves insulin sensitivity, helping regulate blood sugar levels

    Kidney & Urinary Health (73–80)

    1. Helps prevent kidney stones by diluting mineral concentrations in urine
    2. Flushes bacteria from the urinary tract, reducing infection risk
    3. Supports kidney filtration — your kidneys filter approximately 180 litres of blood daily
    4. Reduces the recurrence of urinary tract infections (UTIs)
    5. Prevents dark, concentrated urine that indicates dehydration
    6. Supports the removal of urea and other waste products
    7. Helps maintain healthy urine flow and volume
    8. Reduces the risk of chronic kidney disease when maintained consistently

    Heart & Cardiovascular Health (81–88)

    1. Maintains blood volume, ensuring efficient circulation
    2. Prevents blood from becoming thick and viscous, reducing the risk of clots
    3. Supports stable blood pressure
    4. Reduces strain on the heart by maintaining optimal blood viscosity
    5. Lowers the risk of coronary heart disease events in well-hydrated individuals
    6. Supports healthy cholesterol and triglyceride levels
    7. Improves oxygen delivery throughout the cardiovascular system
    8. Reduces the risk of stroke associated with severe dehydration

    Immune System & Disease Prevention (89–95)

    1. Supports lymphatic system function — the body’s immune highway
    2. Helps transport white blood cells and antibodies to infection sites
    3. Flushes pathogens and cellular waste through urine and sweat
    4. Maintains the moisture of mucous membranes in the nose and throat — the body’s first line of defence against airborne infections
    5. Supports the production of lymph fluid, which is 95% water
    6. Helps maintain a healthy body temperature, which supports immune function
    7. Reduces the duration and severity of common illnesses when properly hydrated

    Mental Health & Wellbeing (96–100)

    1. Reduces symptoms of anxiety and panic — dehydration triggers cortisol (stress hormone) production
    2. Improves overall mood and emotional resilience
    3. Supports better sleep patterns, reducing insomnia related to dehydration
    4. Enhances feelings of vitality and life satisfaction
    5. Promotes a sense of calm and relaxation when consumed mindfully through the day

    Signs You’re Not Drinking Enough Water (Dehydration Symptoms)

    Recognizing dehydration early is crucial. Here are the warning signs, progressing from mild to severe:

    Mild Dehydration (1–3% body weight loss)

    • Thirst
    • Dry mouth, lips, or tongue
    • Slightly darker yellow urine
    • Mild headache
    • Reduced concentration
    • Slight fatigue or sluggishness

    Moderate Dehydration (3–5% body weight loss)

    • Very dark yellow urine
    • Noticeably decreased urine frequency
    • Dry, cool skin
    • Muscle cramps
    • Dizziness or lightheadedness
    • Increased heart rate
    • Irritability and confusion

    Severe Dehydration (5%+ body weight loss) — Seek Medical Help

    • Extreme thirst
    • Little or no urination
    • Very dark amber or brown urine
    • Sunken eyes
    • Rapid heartbeat and breathing
    • Fainting or loss of consciousness
    • Seizures
    • Delirium

    Children and older adults are at the highest risk for severe dehydration because their thirst mechanisms are less reliable. Monitor water intake proactively for these groups.

    Can You Drink Too Much Water? Understanding Overhydration

    While rare, drinking excessive amounts of water too quickly can be dangerous. The condition is called water intoxication or hyponatremia — a potentially fatal drop in blood sodium levels.

    How It Happens

    Your kidneys can process roughly 800 ml to 1 litre of water per hour. Consuming significantly more than this rate overwhelms the kidneys, diluting sodium in the blood and causing cells to swell — including brain cells.

    Who’s at Risk?

    • Endurance athletes (marathon runners, triathletes) who over-hydrate during events
    • People with certain medical conditions (kidney disease, heart failure, SIADH)
    • Participants in water-drinking contests
    • Individuals taking diuretic medications

    Symptoms of Water Intoxication

    • Nausea and vomiting
    • Headache
    • Confusion and disorientation
    • Muscle weakness or cramping
    • Seizures (in severe cases)
    • Loss of consciousness

    How to Avoid It

    • Never drink more than 1 litre per hour over an extended period
    • During endurance exercise, include electrolyte drinks rather than water alone
    • Listen to your body — if you feel bloated or nauseous, stop drinking
    • If urine is completely colourless for extended periods, reduce your intake slightly

    Water-Rich Foods: Hydrate Through Your Diet

    Remember, approximately 20% of your daily water intake comes from food. Here are the top hydrating foods organized by category:

    Top Hydrating Vegetables

    VegetableWater Content
    Cucumber96%
    Lettuce (iceberg)96%
    Celery95%
    Radishes95%
    Zucchini95%
    Tomatoes94%
    Bell peppers (green)94%
    Asparagus93%
    Mushrooms (portobello)93%
    Cabbage93%
    Spinach91%
    Cauliflower92%
    Broccoli91%

    Top Hydrating Fruits

    FruitWater Content
    Watermelon92%
    Strawberries91%
    Grapefruit91%
    Cantaloupe90%
    Peaches89%
    Oranges87%
    Pineapple87%
    Apples84%
    Pears84%
    Kiwi83%

    Including a generous amount of these foods in your daily diet contributes meaningfully to hydration — plus delivers vitamins, minerals, fibre, and antioxidants that plain water doesn’t provide.

    Other Beverages That Count Toward Your Water Intake

    Water is the gold standard for hydration, but other beverages contribute to your daily fluid total:

    BeverageHydration ValueNotes
    Herbal teaExcellentCaffeine-free, counts fully toward water intake
    Green / black teaGoodMild diuretic effect, but net hydration is still positive
    CoffeeGood (in moderation)Up to 3–4 cups/day contributes to hydration despite mild diuretic effect
    MilkExcellentContains water, electrolytes, protein; studies show superior hydration vs. water in some contexts
    Coconut waterExcellentNatural electrolytes; ideal for post-workout recovery
    Fruit juice (100%)ModerateHydrating but high in sugar; limit to small portions
    Sparkling waterExcellentEqually hydrating as still water
    Sports drinksSituationalUseful during intense exercise lasting 60+ minutes; unnecessary for daily hydration
    SodaPoorHigh sugar content outweighs hydration benefit
    AlcoholNegativeDehydrating due to diuretic effect; always pair with water

    Pythagorean Water Intake Formula: A Quick Reference

    Here’s a simplified calculation you can use right now — no calculator needed:

    Step 1: Find Your Base Intake

    Body weight (kg) × 33 ml = Base daily water (ml)

    Step 2: Add Exercise

    + 350 ml for every 30 minutes of exercise

    Step 3: Adjust for Climate

    • Hot weather: × 1.25 (add 25%)
    • Very hot weather: × 1.5 (add 50%)
    • High altitude: × 1.2 (add 20%)

    Quick Example

    A 70 kg woman who exercises moderately (45 minutes/day) in a warm climate:

    • Base: 70 × 33 = 2,310 ml
    • Exercise: +525 ml (45 min ÷ 30 × 350)
    • Climate: × 1.25 = 3,544 ml

    Daily recommendation: approximately 3.5 litres (15 cups)

    For a more precise calculation customized to your exact profile, our Water Intake Calculator handles all the math for you.

    Hydration Tips for Special Situations

    For Athletes and Fitness Enthusiasts

    • Drink 500 ml (2 cups) 2–3 hours before exercise
    • Sip 150–250 ml (5–8 oz) every 15–20 minutes during exercise
    • Drink 500–750 ml (2–3 cups) within 30 minutes of finishing
    • For workouts lasting over 60 minutes, add electrolytes (sodium, potassium, magnesium)
    • Weigh yourself before and after exercise — drink 1.5 litres for every kilogram lost

    For People in Hot Climates

    • Increase baseline intake by 25–50%
    • Drink before going outdoors, not just when you arrive
    • Freeze a partially-filled water bottle overnight and top it up in the morning for cold water throughout the day
    • Eat more water-rich fruits (watermelon, cucumber, oranges)
    • Avoid alcohol and excessive caffeine, which accelerate dehydration

    For Office Workers

    • Keep a water bottle on your desk and refill it at set intervals
    • Drink a glass of water every time you take a break
    • Use the “one glass per hour” rule during the workday (8 glasses across 8 hours)
    • Set digital reminders on your phone or computer
    • Replace afternoon soda or energy drinks with flavoured sparkling water

    For Children

    • Make water the default drink at every meal and snack
    • Use colourful, fun water bottles to encourage drinking
    • Model the behaviour — children imitate what adults do
    • Offer water before, during, and after outdoor play
    • Limit fruit juice to 125 ml per day for ages 1–6 and 250 ml for ages 7–18

    Final Thoughts: Make Hydration a Daily Practice, Not an Afterthought

    Water is the simplest, cheapest, and most effective health intervention available to every human being on the planet. You don’t need a prescription for it. You don’t need special equipment. You just need awareness and consistency.

    The perfect amount of water for you isn’t a universal number — it’s a personal calculation based on who you are, how you live, and what your body demands on any given day. Use the formulas in this guide, pay attention to your body’s signals, and build hydration into your daily routine the way you build in brushing your teeth or eating meals.

    Your body will reward you with clearer skin, sharper thinking, better digestion, stronger performance, and a resilience that most people simply leave on the table — all because they never learned to drink enough water.

    Start today. Your cells are counting on it.

    Tools to Help You Stay Hydrated

    Calculating your perfect daily water intake manually works — but why not make it effortless? Explore our free health and wellness calculators:

    Frequently Asked Questions (FAQ)

    How many litres of water should I drink a day?

    For most adults, the recommended daily water intake from beverages is approximately 2.0–3.0 litres (8–13 cups), depending on gender, body weight, and activity level. Men typically need around 3 litres, while women need about 2.2 litres. These figures represent fluids from beverages and don’t include the additional 0.5–0.7 litres typically obtained from food. Use our Water Intake Calculator for a personalized recommendation.

    Is 4 litres of water a day too much?

    For the average sedentary adult, 4 litres may be more than necessary. However, for larger individuals, athletes, pregnant or breastfeeding women, or those in hot climates, 4 litres can be perfectly appropriate and even required. The key is to spread your intake evenly throughout the day and listen to your body’s signals. If your urine is consistently clear and you’re urinating very frequently, you may want to reduce slightly.

    Does coffee count as water intake?

    Yes, coffee does contribute to your daily fluid intake. Despite caffeine’s mild diuretic effect, research consistently shows that the net hydration effect of moderate coffee consumption (3–4 cups/day) is positive. You don’t need to drink an equal amount of water to “offset” coffee, but it’s still wise to drink an extra half-cup of water per cup of coffee for optimal hydration.

    How much water should a pregnant woman drink?

    Pregnant women should aim for 2.4–3.0 litres (10–12 cups) of total fluids daily. This increased need supports expanded blood volume (which increases by 40–50% during pregnancy), amniotic fluid production, and fetal development. During breastfeeding, this increases further to 3.0–3.8 litres (12–16 cups) daily.

    What’s the best time to drink water?

    The most beneficial times to drink water include: immediately upon waking (to rehydrate after sleep), 30 minutes before each meal (to support digestion), during and after exercise (to replace sweat losses), and throughout the day at regular intervals. Avoid large quantities right before bed to prevent sleep disruption from nighttime bathroom trips.

    Can drinking water help me lose weight?

    Yes, multiple studies support water’s role in weight management. Drinking 500 ml (2 cups) of water before meals has been shown to reduce calorie intake by 75–90 calories per meal. Water also temporarily boosts metabolic rate by up to 30%, supports fat metabolism through lipolysis, and helps the body distinguish genuine hunger from thirst signals. However, water alone is not a substitute for a balanced diet and regular physical activity.

    How do I know if I’m drinking enough water?

    The simplest indicator is your urine colour. Pale straw or light yellow suggests adequate hydration. Dark yellow or amber indicates you need more water. Other signs of proper hydration include: consistent energy levels throughout the day, infrequent headaches, normal bowel movements, moist lips and mouth, and good skin elasticity. Conversely, persistent fatigue, dry skin, infrequent urination, and brain fog suggest dehydration.

    Is it bad to drink water while eating?

    Drinking moderate amounts of water during meals is generally fine and can actually aid digestion by helping break down food. The concern about “diluting digestive juices” is largely exaggerated — your stomach produces acid on demand, and a glass or two of water during a meal doesn’t meaningfully impair digestion. However, avoid gulping very large volumes during meals, and focus most of your water intake between meals.

    How much water does a person lose per day?

    An average sedentary adult loses approximately 2.5–3.0 litres of water per day through normal bodily processes: urination (~1.5 litres), breathing (~400 ml), sweating (~600 ml), and bowel movements (~200 ml). Active individuals, those in hot climates, or people who are ill may lose significantly more — sometimes 5–6 litres or more during intense exercise in hot conditions.

    Are there risks to drinking very cold water?

    While cold water is safe and still hydrating, some evidence suggests that very cold beverages may temporarily constrict blood vessels in the digestive tract, potentially slowing digestion slightly. Cold water can also trigger headaches in people prone to migraines. For most people, room-temperature or cool water is ideal, but cold water is fine — especially during hot weather or intense exercise when rapid cooling is beneficial.

    How much water per day for a 70 kg man?

    A 70 kg man should aim for approximately 2.3–2.5 litres (10–11 cups) of water from beverages daily, based on the formula of 33 ml per kilogram of body weight. This increases with physical activity, hot weather, or illness. The total fluid intake from all sources (beverages + food) would be approximately 3 litres.

    What happens if you don’t drink enough water?

    Chronic dehydration, even at mild levels, leads to reduced cognitive performance, persistent headaches, increased fatigue, poor skin health, constipation, and elevated risk of kidney stones and urinary tract infections. Severe dehydration can cause dangerously low blood pressure, rapid heartbeat, kidney failure, seizures, and in extreme cases, death. Even a 1–2% drop below optimal hydration measurably impairs brain function and physical performance.

    Should I drink 3 litres of water a day?

    For most adult men and larger or very active women, 3 litres of total daily fluid is within the recommended range. For smaller or more sedentary women, 2–2.5 litres from beverages may be sufficient. The right amount depends on your body weight, activity level, climate, and health status. Rather than targeting a fixed number, use a personalized calculation based on your weight and lifestyle.

    Does sparkling water hydrate as well as still water?

    Yes. Sparkling (carbonated) water is equally hydrating as still water. The carbon dioxide that creates the bubbles does not affect your body’s ability to absorb the water. The only consideration is that some people find carbonation causes mild bloating, which may make it harder to drink sufficient volumes. Choose unflavoured varieties without added sugar or sodium for the best hydration benefit.

    Is warm water better than cold water in the morning?

    Many health practitioners recommend warm or room-temperature water in the morning because it is believed to stimulate digestion more gently, improve blood circulation, and help the body flush overnight accumulations of waste. From a strict hydration perspective, both warm and cold water hydrate equally. However, warm water may be easier to drink in larger quantities first thing in the morning and is less likely to cause stomach discomfort.

    How much water should you drink before bed?

    A small glass (125–250 ml) of water about 1 hour before bedtime is generally recommended. This amount provides overnight hydration without causing excessive nighttime urination that disrupts sleep. Avoid drinking large volumes (500 ml+) right before lying down. If you frequently wake up thirsty, increase your water intake during the evening hours rather than immediately before sleep.

    Can too much water damage your kidneys?

    Healthy kidneys can handle large volumes of water without damage. However, consistently drinking far beyond your body’s needs forces the kidneys to work harder to excrete the excess, and in extreme cases, the rapid dilution of sodium can lead to hyponatremia, which can damage the brain before affecting the kidneys. People with existing kidney disease should follow their doctor’s specific fluid recommendations.

    What is the 8×8 rule for water?

    The “8×8 rule” refers to the popular guideline suggesting you drink eight 8-ounce glasses of water per day — totalling about 2 litres (64 ounces). While this serves as a simple, memorable starting point, it’s not based on rigorous scientific evidence and doesn’t account for individual differences in body weight, activity level, or climate. Most health authorities recommend higher amounts for men and adjustments based on personal factors

  • Face Shape Guide: How to Determine Your Face Shape and Why It Matters

    Face Shape Guide: How to Determine Your Face Shape and Why It Matters

    Your face shape is the silent architect of your entire look. It influences which hairstyles frame you best, which glasses complement your profile, how you should apply makeup, and even which accessories work in your favor. Yet surprisingly, most people have never actually identified their face shape or they have been guessing wrong all along.

    This comprehensive guide walks you through everything you need to know about face shapes. You will learn how to accurately measure and identify your own face shape, explore the defining characteristics of every face type, and discover exactly how to use that knowledge to make better style choices whether you are a man or a woman.

    Want instant results? Skip the manual measurements and use our free Face Shape Calculator to identify your face shape in seconds with AI-powered analysis.

    What Is a Face Shape?

    A face shape refers to the geometric outline formed by the contours of your forehead, cheekbones, jawline, and chin when viewed from the front. Think of it as the overall “frame” of your facet he silhouette that remains when you strip away hair, skin texture, and individual features.

    While every face is unique in its exact proportions, facial structures tend to fall into recognizable categories. Dermatologists, stylists, makeup artists, and even plastic surgeons universally classify faces into common types based on the relative widths and angles of four key areas:

    • Forehead width — How broad or narrow the top portion of your face is
    • Cheekbone width — The widest point across the middle of your face
    • Jawline width — How wide or narrow your jaw is at its widest point
    • Face length — The vertical distance from hairline to chin tip

    The relationship between these four measurements determines which of the major face shape categories you fall into.

    Why Does Your Face Shape Matter?

    Knowing your face shape is not mere vanity it is one of the most practical pieces of self-knowledge you can have. Here is why it matters across multiple areas of your life:

    1. Hairstyles That Actually Flatter You

    The single biggest reason people study face shapes is to choose better haircuts. A hairstyle that looks stunning on a magazine model with an oval face might look completely wrong on someone with a square or round face. When you know your shape, you can select cuts that balance your proportions rather than exaggerating them.

    2. Glasses and Sunglasses That Fit Perfectly

    Eyewear is one of the most visible accessories you wear. The wrong frame shape can make your face look wider, longer, or harsher than it is. The right frame creates visual harmony and draws attention to your best features.

    3. Makeup and Contouring That Works

    Professional makeup artists always assess face shape before contouring. The placement of bronzer, highlighter, and blush changes dramatically depending on whether you have a round, heart, or diamond-shaped face.

    4. Hats, Jewelry, and Necklines

    From earring shapes to neckline cuts on shirts and dresses, your face shape influences which accessories and clothing details complement your natural structure.

    5. Confidence and Self-Awareness

    Simply understanding your proportions helps you feel more confident in your choices. Rather than relying on trial and error, you can make informed decisions that consistently enhance your appearance.

    How to Determine Your Face Shape: 3 Proven Methods

    There are three reliable ways to figure out your face shape. You can use one method alone or combine all three for the most accurate result.

    Method 1: The Measurement Method (Most Accurate)

    This is the gold standard for face shape identification. You will need a flexible measuring tape (or a piece of string and a ruler) and a mirror.

    Step 1: Measure Your Forehead Place the tape across the widest part of your forehead, typically halfway between your eyebrows and your hairline. Measure from one temple to the other. Write this number down.

    Step 2: Measure Your Cheekbones Find the pointiest part of each cheekbone usually right below the outer corner of your eye. Measure straight across from one cheekbone to the other, crossing over the bridge of your nose.

    Step 3: Measure Your Jawline Start at the base of your jaw directly below your ear. Measure along the edge of your jaw to the tip of your chin. Then multiply this number by two to get your full jawline width.

    Step 4: Measure Your Face Length Measure from the center of your hairline straight down to the very tip of your chin.

    Step 5: Compare Your Measurements

    Once you have all four measurements, use this comparison chart:

    If your measurements show…Your face shape is likely…
    Face length > cheekbones > forehead > jawline, with a rounded chinOval
    Cheekbones ≈ face length, all measurements are similar, soft jawlineRound
    Forehead ≈ cheekbones ≈ jawline, with angular jawSquare
    Forehead > cheekbones > jawline, with pointed chinHeart
    Cheekbones > forehead ≈ jawline, with angular featuresDiamond
    Face length >> all other measurements, similar widthsOblong/Rectangle
    Jawline > cheekbones > foreheadTriangle (Pear)
    Forehead > jawline, with similar cheekbone and jawline widthsInverted Triangle

    Skip the math: Our Face Shape Calculator does all of this instantly using AI facial landmark detection just upload a photo.

    Method 2: The Mirror Tracing Method

    This is a quick visual method that requires no tools:

    1. Pull all your hair back away from your face.
    2. Stand about 12 inches from a well-lit mirror.
    3. Using a dry-erase marker, lipstick, or bar of soap, trace the outline of your face on the mirror’s surface.
    4. Step back and examine the shape you drew.
    5. Compare the outline to the face shape diagrams below.

    Method 3: The Photo Analysis Method

    1. Take a straight-on selfie in good, even lighting with your hair pulled back.
    2. Open the photo on your phone or computer.
    3. Using a photo editing app, draw lines along your hairline, cheekbones, and jawline.
    4. Examine the resulting shape.

    For the most effortless and accurate approach, upload your photo to our Face Shape Calculator, which uses AI to detect over 400 facial landmarks and classify your face shape with precision.

    The 9 Face Shapes Explained in Detail

    While some resources simplify this to 6 or 7 shapes, there are actually 9 distinct face shape categories widely recognized by dermatologists, beauty professionals, and facial analysis experts.

    1. Oval Face Shape

    Key Characteristics:

    • Face length is approximately 1.5 times the width
    • Cheekbones are the widest part of the face
    • Forehead is slightly wider than the jawline
    • Chin is gently rounded (not pointed, not square)
    • Facial contours have soft, balanced curves

    Why It Is Considered the “Ideal”: The oval face is universally regarded as the most balanced and proportionate face shape. Its gentle tapering from cheekbones to forehead and chin creates symmetry that is considered classically attractive across cultures. Most styling advice aims to create the illusion of an oval shape for other face types.

    Celebrity Examples: Beyoncé, George Clooney, Jessica Alba, Ryan Gosling, Bella Hadid.

    Best For: Virtually any hairstyle, frame shape, or makeup technique. Oval faces have the most versatility.

    2. Round Face Shape

    Key Characteristics:

    • Face length and width are nearly equal
    • Cheekbones are the widest feature, with full cheeks
    • Soft, rounded hairline (no angular corners)
    • Jawline is smooth and undefined, with no sharp angles
    • Chin is small and rounded
    • Overall appearance is youthful and soft

    How to Tell If Your Face Is Round vs. Oval: The key difference is proportional. If your face length is noticeably longer than its width, you are oval. If the length and width are approximately equal, you are round. Round faces also lack the gentle tapering that oval faces have.

    Celebrity Examples: Selena Gomez, Chrissy Teigen, Leonardo DiCaprio (younger), Jack Black, Ginnifer Goodwin.

    Styling Goal: Add angles and elongation to create the illusion of length.

    3. Square Face Shape

    Key Characteristics:

    • Forehead, cheekbones, and jawline are all approximately the same width
    • Strong, angular jawline with sharply defined corners
    • Broad, flat forehead with a relatively straight hairline
    • Face width and length are similar (like a round face but with angles)
    • Prominent cheekbones that align with the jaw

    Celebrity Examples: Angelina Jolie, Olivia Wilde, Brad Pitt, Henry Cavill, Keira Knightley.

    Styling Goal: Soften the strong angular lines and create length.

    4. Heart Face Shape

    Key Characteristics:

    • Forehead is the widest part of the face
    • Cheekbones are wide and pronounced
    • Face narrows significantly toward the chin
    • Chin is pointed or narrow
    • A widow’s peak hairline is common (though not required)
    • Resembles an inverted triangle with a pointed base

    Celebrity Examples: Reese Witherspoon, Scarlett Johansson, Ryan Reynolds, Taylor Swift.

    Styling Goal: Balance the wider upper face by adding width or softness near the jawline and minimizing forehead emphasis.

    Face Shape

    5. Diamond Face Shape

    Key Characteristics:

    • Cheekbones are the widest and most prominent feature
    • Forehead is narrow (narrower than cheekbones)
    • Jawline is narrow and comes to a subtle point
    • Face length is the longest measurement
    • Angular features throughout, giving a “sculpted” appearance
    • One of the rarest face shapes

    Celebrity Examples: Rihanna, Robert Pattinson, Vanessa Hudgens, Halle Berry.

    Styling Goal: Soften the cheekbones and add perceived width to the forehead and jawline for balance.

    6. Oblong (Long) Face Shape

    Key Characteristics:

    • Face is significantly longer than it is wide
    • Forehead, cheekbones, and jawline are similar in width
    • Sides of the face appear relatively straight
    • Chin is rounded (distinguishing it from rectangle)
    • Forehead is typically tall
    • Cheeks may appear elongated

    How to Tell Oblong vs. Oval: Both are longer than wide, but oblong faces have more uniform width from forehead to jaw, while oval faces taper noticeably. Oblong faces also tend to have a notably longer face length relative to width.

    Celebrity Examples: Sarah Jessica Parker, Adam Driver, Liv Tyler, Ben Affleck.

    Styling Goal: Create the illusion of width and break up the length.

    7. Rectangle Face Shape

    Key Characteristics:

    • Similar to oblong, but with angular features
    • Face is longer than it is wide
    • Forehead, cheekbones, and jawline are approximately equal in width
    • Jawline is strong and angular (unlike the rounded jaw of oblong)
    • Combines the length of oblong with the angles of square
    • Straight sides and a defined jaw

    Celebrity Examples: Meryl Streep, Idris Elba, Sarah Paulson.

    Styling Goal: Add width while softening the jawline angles.

    8. Triangle (Pear) Face Shape

    Key Characteristics:

    • Jawline is the widest part of the face
    • Face narrows upward toward a smaller forehead
    • Cheekbones sit between forehead and jawline in width
    • Chin is wide and may be flat or rounded
    • Forehead is noticeably narrow

    Celebrity Examples: Minnie Driver, Eli Manning.

    Styling Goal: Add width to the upper face (forehead and cheekbones) while minimizing jaw emphasis.

    9. Inverted Triangle Face Shape

    Key Characteristics:

    • Forehead is the widest measurement
    • Face narrows dramatically toward the jaw and chin
    • Jawline is narrow and tapered
    • Similar to heart shape but without the pointed chin
    • Chin may be more squared off while still narrower than the forehead

    Celebrity Examples: Naomi Campbell, Jennifer Love Hewitt.

    Styling Goal: Minimize forehead width while adding fullness around the jawline area.

    Face Shapes for Women: A Complete Visual Guide

    Understanding face shapes is particularly important for women because of the vast number of style choices influenced by facial structure from short pixie cuts to long flowing layers, from dramatic contouring to subtle everyday makeup, and from statement earrings to delicate studs.

    Quick Reference: Female Face Shapes at a Glance

    Face ShapeWidest PointJawlineChinProportions
    OvalCheekbonesSoft, taperedRoundedLength > Width
    RoundCheekbones/CheeksSoft, undefinedRoundedLength ≈ Width
    SquareEven throughoutAngular, strongFlat/WideLength ≈ Width
    HeartForeheadTaperedPointedWide top, narrow bottom
    DiamondCheekbonesNarrow, angularPointedNarrow top and bottom
    OblongEven throughoutSoftRoundedLength >> Width
    RectangleEven throughoutAngularFlatLength >> Width
    TriangleJawlineWide, strongWideNarrow top, wide bottom
    Inverted TriangleForeheadNarrowNarrowWide top, narrow bottom

    The most common face shapes among women are oval, round, and heart. Diamond and triangle are the rarest.

    Face Shapes for Men: A Complete Visual Guide

    For men, face shape knowledge drives decisions around haircuts, beard styles, and eyewear three of the biggest factors in a man’s overall appearance.

    Quick Reference: Male Face Shapes at a Glance

    Face ShapeDefining FeatureBest AssetsCommon Look
    OvalBalanced proportionsVersatilityClassic, refined
    RoundFull cheeks, soft jawYouthful appearanceSoft, approachable
    SquareStrong jawlineMasculine definitionRugged, strong
    HeartWide forehead, narrow chinCheekbone definitionDistinguished
    DiamondProminent cheekbonesSculpted lookAngular, striking
    OblongLength dominatesMature, distinguishedElongated, lean
    RectangleLong + angularStrong structureCommanding
    TriangleWide jawStrong foundationSturdy, grounded

    The most common face shapes for men are oval, square, and round. Square and rectangle shapes tend to be perceived as the most traditionally masculine due to their strong jaw definition.

    Best Hairstyles for Each Face Shape (Women)

    Oval Face — Almost Anything Works

    The oval face can pull off the widest range of styles. Long layers, blunt bobs, pixie cuts, curtain bangs, and high ponytails all work beautifully. The only rule is to avoid extreme volume on top, which can elongate an already balanced face.

    Top Picks: Long layers, French bob, textured pixie, curtain bangs, face-framing waves.

    Round Face — Create Length and Angles

    Choose styles that add height on top and create the illusion of a longer face. Avoid blunt cuts at chin level that accentuate width.

    Top Picks: Long layers with a deep side part, asymmetrical lob, high ponytail, side-swept bangs, angular bobs.

    Square Face — Soften the Angles

    Opt for styles that soften the strong jawline. Soft waves, wispy layers, and side parts work better than blunt, geometric cuts.

    Top Picks: Soft waves past the shoulders, wispy side-swept bangs, long layered cuts, textured bobs, face-framing layers.

    Heart Face — Balance the Width

    Add volume around the jawline while keeping the forehead area softer. Side-swept bangs help reduce the visual width of the forehead.

    Top Picks: Chin-length bob, curtain bangs, soft layers that start at the jaw, medium-length waves, side-swept fringe.

    Diamond Face — Highlight and Frame

    Use fringes to add width to the forehead and layers that fall around the jawline to balance the prominent cheekbones.

    Top Picks: Side-swept bangs, chin-length bobs, long layers starting below the cheekbones, textured lobs.

    Oblong/Rectangle Face — Add Width, Reduce Length

    Choose styles that add volume at the sides and avoid adding excessive height on top.

    Top Picks: Shoulder-length cuts with layers, side-swept or blunt bangs to shorten the forehead, wavy bobs, textured medium-length styles.

    Triangle Face — Volume on Top

    Create balance by adding volume and width in the upper portion of the face.

    Top Picks: Voluminous blowouts, side-parted styles with top volume, layered cuts with fullness at the cheekbones, textured pixie cuts.

    Best Hairstyles for Each Face Shape (Men)

    Oval Face

    Best: Short textured crop, classic side part, pompadour, quiff, crew cut, undercut. Avoid: Overly voluminous styles or man buns that elongate the face.

    Round Face

    Best: Pompadour, high fade with textured top, angular fringe, spiky styles with height. Avoid: Buzz cuts or rounded styles that emphasize the circular shape.

    Square Face

    Best: Short textured crop, French crop, side part, quiff with some height. Avoid: Extremely boxy or flat-top cuts that exaggerate the square proportions.

    Heart Face

    Best: Forward-facing textured fringe, medium-length side-swept styles, longer layered cuts. Avoid: High quiffs or pompadours that add vertical emphasis to the wide forehead.

    Diamond Face

    Best: Messy fringe, layered cuts with volume, textured medium-length styles. Avoid: Short sides with no top length, which emphasizes the narrow forehead.

    Oblong/Rectangle Face

    Best: Side-swept fringe, mid-length layered cuts, styles that add width at the sides. Avoid: Tall pompadours or styles that add height and make the face look even longer.

    Triangle Face

    Best: Longer top with tapered sides, volume on top, textured styles with width near the temples. Avoid: Styles that are very short on top but wide at the jaw level.

    Face Shape detector

    Best Glasses and Sunglasses for Each Face Shape

    The golden rule of eyewear is contrast: choose frame shapes that contrast with your face shape to create visual balance. According to leading optometry organizations like the American Academy of Ophthalmology, the right frames can enhance your features while the wrong ones can create visual disharmony.

    Face ShapeBest Frame StylesAvoid
    OvalAlmost any style — aviator, wayfarer, round, cat-eye, rectangularFrames wider than the broadest part of your face
    RoundAngular, rectangular, square, geometric, cat-eye, browlineSmall round frames that echo facial curves
    SquareRound, oval, cat-eye, rimless, thin-framedThick angular or boxy frames
    HeartBottom-heavy frames, aviator, round, oval, rimlessTop-heavy or overly wide frames
    DiamondOval, rimless, cat-eye, browline, semi-rimlessNarrow frames that emphasize width
    OblongDeep frames with more height than width, decorative templesSmall or narrow frames
    TriangleCat-eye, browline, frames with top-heavy detailingBottom-heavy or narrow frames

    Makeup and Contouring Tips by Face Shape

    Contouring is the art of using light and shadow to sculpt your face, and the placement changes dramatically depending on your face shape. Here are the expert-recommended techniques for each shape:

    Oval Face Contouring

    • Contour: Lightly under the cheekbones, along the temples, and under the outer jawline
    • Highlight: Center of forehead, bridge of nose, tops of cheekbones, chin
    • Goal: Enhance natural symmetry without over-sculpting

    Round Face Contouring

    • Contour: Deeply under the cheekbones in an angular motion, along the outer jawline from ear to chin
    • Highlight: Upper cheekbones, brow bones, bridge of nose
    • Goal: Create angular definition and the illusion of length

    Square Face Contouring

    • Contour: The four corners of the face (temples and jaw corners), along the sides of the forehead
    • Highlight: Center of forehead, bridge of nose, tops of cheekbones, center of chin
    • Goal: Soften and round the angular features

    Heart Face Contouring

    • Contour: Temples and outer forehead to reduce width, lightly along the hollows of cheeks
    • Highlight: Center of chin (to broaden it), center of forehead, under eyes
    • Goal: Balance the wider upper face with the narrower chin

    Diamond Face Contouring

    • Contour: Tips of cheekbones (not underneath), sides of forehead and jawline
    • Highlight: Center of forehead and chin to add width to narrow areas
    • Goal: Soften the prominent cheekbones and balance proportions

    Oblong/Rectangle Face Contouring

    • Contour: Along the hairline to reduce forehead height, under the chin to shorten length
    • Highlight: Tops of cheekbones (horizontal application), brow bone
    • Goal: Create width and visually shorten the long face

    Face Shape and Beard Styles for Men

    For men, facial hair is one of the most powerful tools for reshaping the perceived contours of your face. The right beard style can add angles to a round face, soften a square jaw, or balance an elongated face.

    Face ShapeBest Beard StylesWhy It Works
    OvalAlmost any style — full beard, stubble, goateeBalanced proportions allow versatility
    RoundAngular goatee, pointed beard, chinstrap variantsAdds vertical definition, elongates the face
    SquareFull rounded beard, circle beard, medium stubbleSoftens the sharp jaw corners
    HeartFull beard with volume at the jaw, wider goateeAdds width to the narrow lower face
    DiamondFull beard, rounded styles, chin-focused growthAdds width to the narrow jaw area
    OblongShort beard, mutton chops, stubble, sideburns with widthAdds horizontal width, avoids adding length
    TriangleStubble, short boxed beard, avoid jaw-heavy stylesSoftens the already wide jawline

    How AI Face Shape Detectors Work

    Modern face shape detectors use sophisticated artificial intelligence to analyze photographs and determine face shape automatically. Here is how the technology works behind the scenes:

    Step 1: Image Processing

    When you upload a photo, the AI system first preprocesses the image—adjusting brightness, removing noise, and standardizing the size for consistent analysis.

    Step 2: Facial Landmark Detection

    Advanced AI models identify key points on your face called facial landmarks. Modern systems like Google’s MediaPipe can detect over 468 individual landmarks, mapping precise locations around your:

    • Hairline and forehead contour
    • Eyebrows and eye sockets
    • Cheekbone prominence
    • Nose bridge and tip
    • Jawline from ear to chin
    • Chin contour and tip

    Step 3: Measurement and Ratio Calculation

    The system measures the distances and angles between landmarks, calculating critical ratios such as:

    • Face width-to-height ratio
    • Forehead width vs. cheekbone width
    • Cheekbone width vs. jawline width
    • Jaw angle severity
    • Chin shape classification

    Step 4: Machine Learning Classification

    These measurements are fed into a trained machine learning model (typically a Convolutional Neural Network or CNN) that has been trained on thousands of classified facial images. The model compares your ratios against known patterns for each face shape category and assigns the closest match.

    Step 5: Results and Recommendations

    The tool displays your determined face shape along with personalized recommendations for hairstyles, glasses, and other style choices.

    Try it now: Our Face Shape Calculator uses this exact AI-powered process to give you instant, accurate results.

    Face Shape vs. Head Shape: Is There a Difference?

    Yes, face shape and head shape are related but distinct concepts.

    Face shape refers to the frontal outline of your face what you see when you look straight into a mirror. It is determined by the soft tissue, bone structure, and fat distribution of the forehead, cheeks, jaw, and chin.

    Head shape is the three-dimensional form of your entire skull, including the profile (side view), top view, and back. Head shapes include classifications like:

    • Dolichocephalic (long and narrow)
    • Brachycephalic (short and wide)
    • Mesocephalic (medium proportions)

    Your head shape becomes particularly relevant when choosing hats, helmets, and assessing your side profile. Your face shape is more relevant for hairstyles, glasses, makeup, and general aesthetics from the front.

    The Most Common and Most Attractive Face Shapes

    Most Common Face Shapes

    Research published in the Journal of Craniofacial Surgery and various anthropometric studies indicate that the most common face shapes worldwide are:

    1. Oval — The most common overall
    2. Round — Particularly common in Asian populations
    3. Square — Common in men
    4. Heart — Common in women

    The rarest shapes are diamond and triangle.

    The “Most Attractive” Face Shape

    Studies on facial attractiveness consistently point to the oval face as the most universally attractive, primarily because of its balanced proportions and symmetry. However, attractiveness is highly subjective and culturally influenced:

    • Square faces are often considered the most attractive for men due to the strong jawline association with masculinity
    • Heart and oval faces frequently rank highest for women in Western beauty standards
    • Diamond faces are prized for their sculpted, editorial appearance

    It is important to note that every face shape is attractive—the key is understanding how to style and present your unique structure to its best advantage.

    Can Your Face Shape Change Over Time? 

    Yes, your face shape can shift throughout your life due to several factors:

    Natural Aging

    As you age, you lose subcutaneous fat in your face, and the skin begins to sag due to reduced collagen and elastin. A round face in your twenties may become more oblong or square in your fifties as fat diminishes around the cheeks and the jawline becomes more pronounced.

    Weight Changes

    Significant weight gain or loss affects the fat distribution in your face. Weight gain often makes faces appear rounder, while weight loss can reveal sharper jawlines and cheekbones.

    Hormonal Changes

    Puberty, pregnancy, menopause, and hormonal shifts can affect fat distribution and bone density in the face, subtly altering your face shape over time.

    Dental and Orthodontic Work

    Major dental procedures, jaw surgery, or years of orthodontic treatment can alter your jawline and chin structure, affecting your overall face shape.

    Mewing and Jaw Exercises

    While controversial, some practitioners of mewing (a tongue-posture technique) claim it can subtly reshape the jawline and midface over extended periods, particularly in younger individuals whose bones are still developing.

    Final Thoughts

    Your face shape is one of the most fundamental aspects of your physical identity—and understanding it gives you a genuine advantage in every style decision you make. From choosing the right haircut that frames your features beautifully to picking sunglasses that balance your proportions and applying makeup that sculpts your best angles, face shape knowledge transforms guesswork into confidence.

    Whether you learned through careful measurements, mirror tracing, or a quick analysis with our AI-powered tool, the important thing is that you now understand your unique facial geometry and how to work with it—not against it.

    Every face shape is beautiful. The goal is never to “fix” what you have, but to understand and enhance it.

    Ready to discover your face shape?

    Find Your Face Shape Now →

    Frequently Asked Questions

    What face shape do I have?

    To determine your face shape, you can take four key measurements: forehead width, cheekbone width, jawline width, and face length. Compare these to identify whether your face is oval, round, square, heart, diamond, oblong, rectangle, or triangle. For the fastest result, use our Face Shape Calculator which uses AI to analyze a photo and tell you instantly.

    How do I determine my face shape?

    There are three main methods: (1) Take physical measurements of your forehead, cheekbones, jawline, and face length using a flexible tape measure. (2) Trace the outline of your face on a mirror using a dry-erase marker. (3) Upload a front-facing photo to an AI face shape detector tool. All three methods compare your proportions to the standard face shape categories.

    What is the most common face shape?

    The oval face shape is generally considered the most common worldwide, followed closely by round and square. However, the distribution varies by ethnicity, age, and gender. For women, oval and heart shapes are the most prevalent. For men, oval and square shapes are most common.

    What is the most attractive face shape?

    While beauty is subjective, research consistently identifies the oval face as the most universally attractive due to its balanced and symmetrical proportions. However, square faces are particularly admired in men for their strong jawline, and heart-shaped faces are frequently highlighted as attractive in women.

    Can I change my face shape?

    Your basic bone structure is genetically determined and does not change without surgical intervention. However, factors like weight, aging, hairstyle, makeup contouring, and facial hair (for men) can significantly alter the perceived shape of your face. Major changes are possible through cosmetic procedures such as jaw contouring, chin implants, or buccal fat removal.

    What is the difference between oval and oblong face shapes?

    Both oval and oblong faces are longer than they are wide. The key difference is proportional balance: an oval face tapers gracefully from wider cheekbones to a narrower forehead and chin, creating a balanced egg-like shape. An oblong face has more uniform width from forehead to jaw, with less tapering, creating a longer and more rectangular appearance with softer corners.

    How do AI face shape detectors work?

    AI face shape detectors use computer vision and machine learning to analyze photographs. They detect facial landmarks (key points on the face), measure distances and angles between those points, calculate facial ratios, and compare them against trained models to classify the face shape. Advanced systems like Google’s MediaPipe can detect over 468 individual facial landmarks for highly accurate results.

    What is the best hairstyle for my face shape?

    The best hairstyle depends entirely on your face shape. The general principle is to choose styles that contrast with your natural proportions: round faces benefit from angular, elongating cuts; square faces look best with softer, layered styles; oblong faces need width-adding cuts; and oval faces can wear almost anything. Use our Face Shape Calculator to identify your shape and get personalized recommendations.

    What glasses suit my face shape?

    The rule of contrast applies: round faces suit angular frames, square faces suit round or oval frames, heart faces suit bottom-heavy or rimless frames, and oval faces can wear virtually any style. The goal is always to create visual balance between the frame shape and your facial contours.

    Are face shape apps accurate?

    AI-powered face shape apps have become remarkably accurate, especially those using advanced facial landmark detection with hundreds of data points. However, accuracy depends on photo quality—use a well-lit, front-facing photo with hair pulled back for the best results. Most quality apps achieve 85-95% accuracy when given a good photo.

    What face shape do most models have?

    Professional fashion models most commonly have oval or diamond face shapes. The oval shape’s balanced proportions photograph well from multiple angles, while the diamond shape’s prominent cheekbones create the striking, editorial look prized in high fashion. However, successful models exist with every face shape—diversity in the industry continues to grow.

    Is my face round or oval?

    The simplest test: if your face length and width are nearly equal, you have a round face. If your face is noticeably longer than it is wide (roughly 1.5:1 ratio), you have an oval face. Round faces also have softer, less defined jawlines, while oval faces taper toward the chin.

  • Ideal Weight for Women by Height: The Complete Chart, Formulas & What Actually Matters in 2026

    Ideal Weight for Women by Height: The Complete Chart, Formulas & What Actually Matters in 2026

    Let’s be honest you’ve probably Googled “how much should I weigh for my height” at some point. Maybe you stepped on the scale this morning and the number threw you off. Or maybe your doctor mentioned your weight at your last checkup and now it’s stuck in your brain. Whatever the reason, you’re here looking for a straight answer.

    Here’s the thing nobody tells you upfront: there’s no single “perfect” number. Your ideal body weight depends on your height, yes but also your bone structure, muscle mass, age, and honestly, how your body feels day to day.

    That said, there are established medical formulas and research-backed ranges that give you a solid starting point. And that’s exactly what this guide delivers. Not vague, feel-good platitudes. Real numbers, real charts, real explanations.

    I spent a good chunk of time pulling together every credible formula, building comparison charts, and putting this together so you don’t have to bounce between ten different websites trying to piece it together yourself.

    If you want to skip the reading and get your number right now, go ahead and use our Ideal Weight Calculator it runs multiple formulas at once and gives you a personalized healthy weight range in seconds.

    Otherwise, let’s get into it.

    What Is “Ideal Weight” and Who Decides It?

    The concept of “ideal body weight” (IBW) originally had nothing to do with how you look in a mirror. It was developed in the 1970s by researchers who needed a standardized way to calculate medication dosages and assess nutritional status in clinical settings.

    Dr. B.J. Devine published the first widely used IBW formula in 1974. His formula was originally designed for calculating drug doses specifically aminoglycoside antibiotics where getting the dose wrong could be dangerous. It was never intended to tell women what they “should” weigh for cosmetic purposes.

    Over the decades, other researchers Robinson, Miller, and Hamwi developed their own formulas, each with slightly different assumptions about body composition and frame size. These are the formulas your doctor may reference, the ones used in fitness assessments, and the ones behind most online calculators.

    Here’s what “ideal weight” actually means in a medical context:

    • The weight at which a person of a given height has the lowest statistical risk for weight-related health complications
    • reference point for healthcare decisions not a mandate
    • range, not a single number every reputable formula produces a range, not a fixed target

    If someone tells you there’s one exact weight you should be, they’re oversimplifying. Human bodies are not spreadsheets.

    Why Height Is the Starting Point for Women’s Ideal Weight

    Height is the single most reliable baseline for estimating ideal weight because taller people naturally carry more bone, organ tissue, and lean mass. A woman who is 5’9″ has larger bones, a longer torso, and more skeletal muscle than a woman who is 5’1″ so of course she’ll weigh more at a healthy weight.

    Every major ideal weight formula uses height as the primary input. The logic is straightforward:

    FactorHow It Relates to Weight
    Bone length and densityTaller women have longer, heavier bones
    Organ sizeLarger frames house larger internal organs
    Muscle distributionMore height = more surface area for muscle attachment
    Blood volumeTaller bodies require more circulating blood

    This is also why comparing your weight to a friend who’s 4 inches shorter or taller than you makes absolutely no sense. A weight that’s perfectly healthy for someone at 5’3″ could be underweight for someone at 5’7″.

    That’s why a height-based chart, combined with your individual body frame, gives you a much more useful picture than the scale alone.

    Complete Ideal Weight Chart for Women by Height

    This is the chart most people are looking for. I’ve compiled results from four different medical formulas Devine, Robinson, Miller, and Hamwi and calculated the average to give you a comprehensive ideal weight range for each height.

    Ideal Weight for Women: Full Height-to-Weight Chart (Ages 18+)

    eightDevine Formula (lbs)Robinson Formula (lbs)Miller Formula (lbs)Hamwi Formula (lbs)Average Ideal Weight (lbs)Healthy BMI Range (lbs)
    4’10”95.7101.4104.595.099.291–119
    4’11”100.1105.2107.8100.0103.394–124
    5’0″104.5108.9111.0105.0107.497–128
    5’1″108.9112.7114.2110.0111.5100–132
    5’2″113.3116.4117.5115.0115.6104–136
    5’3″117.7120.2120.7120.0119.7107–141
    5’4″122.1123.9123.9125.0123.7110–145
    5’5″126.6127.7127.2130.0127.9114–150
    5’6″131.0131.4130.4135.0132.0118–154
    5’7″135.4135.2133.6140.0136.1121–159
    5’8″139.8138.9136.9145.0140.2125–164
    5’9″144.2142.7140.1150.0144.3128–169
    5’10”148.6146.5143.3155.0148.4132–174
    5’11”153.0150.2146.6160.0152.5136–179
    6’0″157.4154.0149.8165.0156.6140–184
    6’1″161.9157.7153.0170.0160.7144–189
    6’2″166.3161.5156.3175.0164.8148–194

    Important note: These numbers represent a starting reference point. Your actual ideal weight can be 10–15% higher or lower depending on your body frame size and muscle composition. Use our Ideal Weight Calculator to get a personalized number that accounts for your specific body type.

    Quick Reference: Ideal Weight for the Most Common Heights

    Since most women fall between 5’0″ and 5’8″, here’s a quick snapshot:

    • Ideal weight for 5’0″ woman: 97–128 lbs (average formula result: ~107 lbs)
    • Ideal weight for 5’1″ woman: 100–132 lbs (average formula result: ~112 lbs)
    • Ideal weight for 5’2″ woman: 104–136 lbs (average formula result: ~116 lbs)
    • Ideal weight for 5’3″ woman: 107–141 lbs (average formula result: ~120 lbs)
    • Ideal weight for 5’4″ woman: 110–145 lbs (average formula result: ~124 lbs)
    • Ideal weight for 5’5″ woman: 114–150 lbs (average formula result: ~128 lbs)
    • Ideal weight for 5’6″ woman: 118–154 lbs (average formula result: ~132 lbs)
    • Ideal weight for 5’7″ woman: 121–159 lbs (average formula result: ~136 lbs)
    • Ideal weight for 5’8″ woman: 125–164 lbs (average formula result: ~140 lbs)

    The 4 Major Formulas Used to Calculate Ideal Body Weight

    If you’ve ever wondered where the numbers in those ideal weight charts come from, here are the four peer-reviewed formulas that have been used in clinical medicine for decades. Each one approaches the calculation slightly differently.

    1. The Devine Formula (1974)

    Developed by Dr. B.J. Devine, this is the most widely used formula and the one most online calculators default to.

    Women: Ideal Weight (kg) = 45.5 + 2.3 × (height in inches − 60)

    For a 5’4″ woman (64 inches):
    45.5 + 2.3 × (64 − 60) = 45.5 + 9.2 = 54.7 kg ≈ 120.6 lbs

    2. The Robinson Formula (1983)

    Dr. J.D. Robinson updated Devine’s formula with adjusted coefficients based on broader population data.

    Women: Ideal Weight (kg) = 49 + 1.7 × (height in inches − 60)

    For a 5’4″ woman:
    49 + 1.7 × (64 − 60) = 49 + 6.8 = 55.8 kg ≈ 123.0 lbs

    3. The Miller Formula (1983)

    Dr. D.R. Miller provided a formula that tends to produce slightly higher results for shorter women and lower results for taller women.

    Women: Ideal Weight (kg) = 53.1 + 1.36 × (height in inches − 60)

    For a 5’4″ woman:
    53.1 + 1.36 × (64 − 60) = 53.1 + 5.44 = 58.5 kg ≈ 129.0 lbs

    4. The Hamwi Formula (1964)

    Dr. G.J. Hamwi’s formula is one of the oldest and is still commonly used in clinical nutrition settings.

    Women: 100 lbs for the first 5 feet + 5 lbs for each additional inch

    For a 5’4″ woman:
    100 + (5 × 4) = 120 lbs

    Which Formula Is “Best”?

    Honestly, none of them is perfect on its own. Here’s how they compare:

    FormulaTends To…Best For…
    DevineSlightly underestimate for short womenGeneral reference, drug dosing
    RobinsonGive moderate estimatesClinical assessments
    MillerSkew higher across all heightsWomen with larger frames
    HamwiSimple round numbersQuick mental calculations

    The smartest approach is to average all four and then adjust based on your body frame size (which we cover below). That’s exactly what our Ideal Weight Calculator does it runs all four and gives you the combined range.

    How BMI Fits Into the Picture (And Where It Falls Short)

    Body Mass Index (BMI) is probably the metric you’ve heard about the most. It’s simple to calculate:

    BMI = (Weight in pounds ÷ Height in inches²) × 703

    The World Health Organization and most national health agencies categorize BMI like this:

    BMI RangeCategory
    Below 18.5Underweight
    18.5–24.9Normal weight
    25.0–29.9Overweight
    30.0 and aboveObese

    Where BMI Gets It Right

    • It’s quick, free, and easy to calculate
    • Large population studies confirm a general correlation between high BMI and increased risk of heart disease, type 2 diabetes, and certain cancers
    • It works reasonably well for people with average body compositions

    Where BMI Gets It Wrong

    BMI has real limitations, and I want to be upfront about them:

    1. It doesn’t distinguish fat from muscle. A woman who weight trains regularly and has significant lean muscle can easily show up as “overweight” on the BMI scale when she’s actually in excellent health.
    2. It ignores body fat distribution. Where you carry fat matters enormously. Visceral fat (around the abdomen and organs) is far more dangerous than subcutaneous fat (under the skin). Two women can have identical BMIs but very different health profiles based on where their fat is stored.
    3. It wasn’t designed for all ethnicities. The original BMI thresholds were developed using primarily European population data. Research suggests that health risks begin at lower BMI thresholds for people of South Asian, East Asian, and Southeast Asian descent, and at higher thresholds for people of Pacific Islander descent.
    4. It changes with age. Older women naturally lose muscle mass and gain fat, which means a BMI of 24 at age 65 represents a very different body composition than a BMI of 24 at age 30.
    5. It doesn’t account for bone density. Women with naturally denser, heavier bones will weigh more and that has nothing to do with fat.

    The Bottom Line on BMI

    BMI is a useful screening tool but a terrible diagnostic tool. Use it as one data point alongside body frame, waist measurements, how you feel physically, and your doctor’s assessment. Don’t treat it as the final verdict on your health.

    Body Frame Size: Why Two Women at the Same Height Can Have Different Ideal Weights

    This is one of the most overlooked pieces of the ideal weight puzzle, and it’s the reason so many women feel frustrated when charts don’t seem to “fit” them.

    Your body frame determined by your bone structure significantly impacts what a healthy weight looks like for you. Someone with a naturally wider, heavier skeleton will weigh more than someone with a narrower, lighter skeleton, even at the same height and similar body fat percentage.

    The Three Body Frame Categories

    Frame SizeCharacteristicsIdeal Weight Adjustment
    Small frameNarrow shoulders, small wrists, slender buildSubtract ~10% from calculated ideal weight
    Medium frameAverage proportions, moderate bone widthUse calculated ideal weight as-is
    Large frameBroader shoulders, wider hips, thicker wristsAdd ~10% to calculated ideal weight

    What This Looks Like in Practice

    Let’s say the average formula puts a 5’5″ woman’s ideal weight at about 128 lbs.

    • Small frame: 128 − 10% = ~115 lbs
    • Medium frame: ~128 lbs
    • Large frame: 128 + 10% = ~141 lbs

    That’s a 26-pound difference between the small and large frame and both are perfectly healthy.

    This explains why your coworker who’s the exact same height as you looks great at 140 while you feel your best at 118. Different skeletons, different ideal targets. Neither is wrong.

    Ideal Weight by Height and Age Does Age Change Things?

    Short answer: yes, but not as dramatically as most people think.

    As women age, several physiological changes affect body composition:

    What Changes After 30

    • Muscle mass declines at a rate of about 3–8% per decade after age 30 (a process called sarcopenia)
    • Metabolism slows because muscle burns more calories than fat at rest
    • Bone density decreases, especially after menopause
    • Hormone shifts  declining estrogen causes fat redistribution from hips and thighs to the abdominal area
    • Water retention patterns change

    How Age Affects Ideal Weight

    Age RangeWhat to Expect
    18–29Ideal weight formulas are most accurate for this group
    30–39May carry 3–5 extra pounds above formula weight without health concerns
    40–49Focus shifts to body composition over pure weight maintaining muscle becomes critical
    50–59Post-menopausal hormone changes may shift weight distribution; a slightly higher weight may actually be protective
    60+Moderate overweight (BMI 25–27) is associated with lower mortality risk in older adults compared to “normal” BMI this is called the “obesity paradox”

    The takeaway here is nuanced. For younger women, the standard ideal weight formulas are reasonably accurate. For women over 50, the evidence suggests that being slightly over the formula weight may actually be healthier than being slightly under it, possibly because the extra weight provides a reserve during illness and protects against bone fractures.

    Healthy Weight vs. Ideal Weight, They’re Not the Same Thing

    People use “ideal weight” and “healthy weight” interchangeably, but they mean different things.

    ConceptWhat It Means
    Ideal weightA calculated number based on height using a mathematical formula originally designed for clinical/pharmacological purposes
    Healthy weightA broader range of weights at which your body functions well, blood markers are normal, energy is good, and disease risk is low

    You can be at a “healthy weight” while being 15–20 pounds above your formula-calculated “ideal weight” especially if you’re active, have good cardiovascular fitness, normal blood pressure, and healthy cholesterol levels.

    A woman who weighs 145 lbs at 5’4″ is technically above the Devine formula’s ideal of 122 lbs. But if she exercises regularly, eats nutritious food, sleeps well, and her bloodwork looks great she’s at a healthy weight. The formula doesn’t know about her muscle mass, her genetics, or her lifestyle.

    Signs You’re at a Healthy Weight (Regardless of the Number)

    • Your energy levels are consistent throughout the day
    • You can perform daily activities without excessive fatigue
    • Your blood pressure, blood sugar, and cholesterol are in normal ranges
    • You sleep well and recover from workouts normally
    • Your joints don’t ache under your body weight
    • Your menstrual cycle is regular (irregular periods can signal being too underweight or too overweight)
    • You feel strong, not depleted

    How to Measure Your Body Frame at Home

    You don’t need fancy equipment for this. Here are two methods that work:

    Method 1: The Wrist Measurement

    Wrap your thumb and middle finger around your opposite wrist, right at the narrowest point (where you’d wear a watch).

    ResultYour Frame Size
    Fingers overlapSmall frame
    Fingers just touchMedium frame
    Fingers don’t touchLarge frame

    Method 2: Wrist Circumference (More Precise)

    Use a flexible measuring tape or a piece of string to measure your wrist circumference at the widest point below the wrist bone.

    For women:

    Your HeightSmall FrameMedium FrameLarge Frame
    Under 5’2″Less than 5.5″5.5″–5.75″Over 5.75″
    5’2″ to 5’5″Less than 6.0″6.0″–6.25″Over 6.25″
    Over 5’5″Less than 6.25″6.25″–6.5″Over 6.5″

    Once you know your frame size, go back to the ideal weight chart above and apply the ±10% adjustment. Or even easier plug your height into our Ideal Weight Calculator and let it handle the math.

    Waist-to-Hip Ratio: Another Piece of the Puzzle

    Your waist-to-hip ratio (WHR) is surprisingly important because it tells you where your body stores fat and that matters more for health than total weight in many cases.

    How to Calculate Your WHR

    1. Measure your waist at the narrowest point (usually at or just above the belly button)
    2. Measure your hips at the widest point (usually around the buttocks)
    3. Divide waist measurement by hip measurement

    Example: Waist = 28 inches, Hips = 38 inches → WHR = 28 ÷ 38 = 0.74

    What Your WHR Means

    WHR for WomenRisk Level
    Below 0.80Low health risk
    0.80–0.85Moderate health risk
    Above 0.85High health risk

    Research published by the World Health Organization consistently shows that women with a WHR above 0.85 face significantly higher risks of cardiovascular disease, type 2 diabetes, and metabolic syndrome even if their overall weight and BMI are in the “normal” range.

    This is why a woman who weighs 130 lbs but carries most of it in her midsection may actually face more health risks than a woman who weighs 150 lbs but carries weight in her hips and thighs. The distribution matters.

    Why Muscle Mass Changes Everything About Weight

    Here’s a fact that changes the whole conversation: muscle tissue is about 18% denser than fat tissue. A pound of muscle takes up roughly 22% less space than a pound of fat.

    This means two women at 5’5″ who both weigh 140 lbs can look completely different:

    • Woman A: 140 lbs, 32% body fat, sedentary carries visible abdominal fat, limited muscle definition
    • Woman B: 140 lbs, 22% body fat, strength trains 3x/week lean arms, flat abdomen, visible muscle tone

    Same height. Same weight. Extremely different body compositions and health profiles.

    Healthy Body Fat Ranges for Women

    CategoryBody Fat Percentage
    Essential fat10–13%
    Athletic14–20%
    Fitness21–24%
    Acceptable25–31%
    Obese32%+

    Women naturally carry more body fat than men between 6–11% more because of hormonal differences and reproductive needs. A body fat percentage that would be considered “fit” for a man (15%) would put a woman in the “essential fat” category, which would likely cause menstrual irregularities and health problems.

    Why the Scale Can’t Measure Fitness

    If you start resistance training and eating more protein, you might actually gain 5–10 lbs while dropping a clothing size or two. This is your body replacing fat with denser muscle tissue. The scale goes up, your waistline goes down, and you feel better than ever.

    This is why fixating on a single number on the scale can be misleading especially for active women. Body measurements, how clothes fit, energy levels, and strength benchmarks are often better indicators of progress than weight alone.

    When the Scale Lies: Weight Fluctuations That Don’t Mean Anything

    Your body weight can fluctuate by 2–6 pounds in a single day. I’ve seen women spiral into anxiety over what amounts to normal water weight shifts. Here’s what causes those day-to-day swings:

    Normal Causes of Weight Fluctuation

    FactorHow Much It Can AddDuration
    Sodium intake2–4 lbs24–48 hours
    Menstrual cycle (luteal phase)2–8 lbsSeveral days before period
    Carbohydrate loading1–3 lbsUntil glycogen is used
    Undigested food1–3 lbs12–24 hours
    Hydration status1–4 lbsHours
    Intense exercise1–3 lbs (gain from inflammation)24–72 hours
    Alcohol consumption1–2 lbs (dehydration then rebound)24–48 hours
    Stress (cortisol)1–5 lbs (water retention)Variable

    If you weigh yourself every single morning, you’re not tracking fat loss you’re tracking water, food, and hormones. For meaningful weight trends, weigh yourself at the same time, under the same conditions, once a week, and look at the 4-week average rather than any individual reading.

    The Menstrual Cycle and Weight

    This deserves its own callout because it catches so many women off guard. In the second half of your cycle (the luteal phase, roughly days 14–28), elevated progesterone causes your body to retain more water. You may notice bloating, breast tenderness, and a higher number on the scale.

    This is not fat gain. It’s hormonal water retention that resolves within a few days of your period starting. If you’re tracking weight, note where you are in your cycle otherwise the data will look erratic and stress you out for no reason.

    How to Reach Your Ideal Weight Safely

    If there’s a gap between where you are and where you want to be, here’s how to close it without wrecking your metabolism or your mental health.

    If You Need to Lose Weight

    1. Find your maintenance calories first. Before cutting anything, figure out how many calories your body needs to maintain its current weight. A rough estimate: multiply your weight in pounds by 12–14 (depending on activity level).
    2. Create a modest deficit. Aim for 300–500 calories below maintenance. This produces a sustainable 0.5–1 lb per week loss. Anything more aggressive than this tends to sacrifice muscle mass and trigger metabolic adaptation.
    3. Prioritize protein. Aim for 0.7–1.0 grams of protein per pound of body weight. Protein preserves lean muscle, keeps you full, and has a higher thermic effect (your body burns more calories digesting it).
    4. Move your body consistently. Combination of resistance training (2–3 times per week) and regular walking (7,000–10,000 steps daily) is more effective than cardio alone.
    5. Sleep 7–9 hours. Sleep deprivation increases ghrelin (hunger hormone), decreases leptin (satiety hormone), and impairs insulin sensitivity. You can’t out-exercise or out-diet bad sleep.
    6. Be patient. Healthy fat loss takes months, not weeks. If you have 20 lbs to lose, give yourself 5–6 months minimum.

    If You Need to Gain Weight

    1. Eat in a caloric surplus. Add 300–500 calories above maintenance, focusing on nutrient-dense foods rather than just eating more junk.
    2. Strength train to build muscle. Without resistance training, excess calories get stored as fat. With it, a significant portion becomes lean tissue.
    3. Include healthy fats. Avocados, nuts, olive oil, and fatty fish provide calorie-dense nutrition without massive volumes of food.
    4. Eat more frequently. If you’re struggling to eat enough in three meals, split into 5–6 smaller meals throughout the day.
    5. Check for underlying issues. If you struggle to gain weight despite eating adequately, talk to your doctor. Thyroid issues, celiac disease, and other conditions can interfere with nutrient absorption.

    Red Flags: When to Talk to a Doctor About Weight

    While this guide gives you research-backed reference points, certain situations require professional medical guidance. See a doctor if you experience:

    • Unexplained weight loss of more than 5% of your body weight in 6–12 months
    • Unexplained weight gain that isn’t related to diet, medication, or lifestyle changes
    • Amenorrhea (loss of menstrual period) linked to low body weight or extreme exercise
    • Disordered eating patterns restricting, bingeing, purging, or obsessive calorie counting
    • Joint pain or mobility issues related to carrying excess weight
    • Blood test abnormalities  elevated fasting glucose, cholesterol, or blood pressure
    • Extreme fatigue or inability to perform daily activities
    • Body dysmorphia  persistent dissatisfaction with your body despite being at a healthy weight

    Weight is a health metric, not a moral measurement. A good doctor will look at the whole picture your blood markers, your energy, your mobility, your mental health not just the number on the scale.

    Understanding Body Composition Beyond Weight

    Weight is one metric. Body composition gives you the full story. Here’s how different methods stack up for women who want to truly understand their bodies:

    Methods for Measuring Body Composition

    MethodAccuracyCostAccessibility
    DEXA ScanVery high (±1–2%)$75–200 per scanMedical facilities, some gyms
    Hydrostatic WeighingHigh (±1.5–2%)$40–100University labs, specialized facilities
    Bioelectrical Impedance (BIA)Moderate (±3–5%)$20–50 (or free with smart scales)Home scales, gyms
    Skinfold CalipersModerate (±3–4%)$5–20 (for calipers)Home, trainer, doctor’s office
    Body CircumferencesLow–ModerateFreeAnywhere with a tape measure
    Visual AssessmentLowFreeMirror

    If you’re serious about understanding your body composition rather than just weight, a DEXA scan every 6–12 months gives you the most complete data including bone density, lean mass by region, and visceral fat estimation.

    For day-to-day tracking, body measurements (waist, hips, thighs, arms) combined with progress photos every 4 weeks tell you far more than daily weigh-ins ever could.

    The Connection Between Ideal Weight and Metabolic Health

    Your weight exists within a larger metabolic context. Research increasingly shows that metabolic health markers matter more than weight alone. Here are the key markers your doctor should be checking:

    The 5 Pillars of Metabolic Health

    1. Fasting blood glucose: Below 100 mg/dL
    2. Triglycerides: Below 150 mg/dL
    3. HDL cholesterol: Above 50 mg/dL for women
    4. Blood pressure: Below 120/80 mmHg
    5. Waist circumference: Below 35 inches for women

    A 2024 analysis estimated that only about 12% of American adults are metabolically healthy by all five criteria. You can be “normal weight” and metabolically unhealthy (sometimes called “skinny fat” or “metabolically obese normal weight”). You can also be mildly “overweight” by BMI and metabolically healthy.

    This is why chasing a specific number on the scale while ignoring blood panels and body composition metrics can lead you in the wrong direction entirely.

    Ideal Weight for Women: Height-by-Height Deep Dive

    Let’s break down the most searched heights individually, because I know you’re probably looking for your specific height.

    Ideal Weight for a 5’0″ Woman

    At 5 feet even, the formula average puts you at roughly 107 lbs, with a healthy range of 97–128 lbs. If you have a small frame, somewhere around 97–107 lbs will feel right. A large frame? You might be completely healthy at 118–128 lbs. The average American woman at this height weighs approximately 127 lbs.

    Ideal Weight for a 5’2″ Woman

    Formula average: approximately 116 lbs. Healthy range: 104–136 lbs. This is one of the most common heights for women globally. At this height, losing even 5 lbs of excess weight can noticeably improve energy levels and joint comfort.

    Ideal Weight for a 5’4″ Woman

    This is roughly the average height for American women. Formula average: about 124 lbs. Healthy range: 110–145 lbs. With the average American woman weighing 170.8 lbs, there’s a significant gap between “average” weight and what the medical formulas suggest as “ideal.”

    Ideal Weight for a 5’6″ Woman

    Formula average: approximately 132 lbs. Healthy range: 118–154 lbs. Women at this height often have more flexibility in their ideal weight range because they have more skeletal surface area.

    Ideal Weight for a 5’8″ Woman

    Formula average: about 140 lbs. Healthy range: 125–164 lbs. At this height, you’re taller than approximately 85% of American women. Your frame likely supports more weight comfortably, especially if you’re athletic.

    Final Thoughts

    I’m not going to pretend that weight doesn’t matter. It does for health, for mobility, for longevity. But the number on your scale is just one piece of an incredibly complex puzzle.

    If I could leave you with just three things from this entire guide:

    1. Your ideal weight is a range, not a point. The spread between the four major formulas for any given height is about 10–15 lbs. Add in body frame variation and you’re looking at a 25–30 lb range where you could be perfectly healthy. Stop trying to hit an exact number.
    2. How your body works matters more than how much it weighs. Normal blood pressure, stable blood sugar, functional strength, regular menstrual cycles, consistent energy these markers tell you more about your health than a bathroom scale ever will.
    3. Track trends, not moments. Your weight tomorrow morning is meaningless in isolation. Your weight trend over the past three months? That tells a story worth listening to.

    If you want a quick way to find your personalized ideal weight range based on your specific height, try our Ideal Weight Calculator. It applies all four medical formulas and gives you a clear, easy-to-read result.

    Take care of yourself. Not because a chart says so. Because you deserve to feel strong, energized, and comfortable in the body you live in every single day.

     FAQs About Ideal Weight for Women

    How much should a 5’4″ woman weigh?

    Based on the average of four major medical formulas (Devine, Robinson, Miller, Hamwi), a 5’4″ woman should weigh approximately 110–145 lbs. The formula average gives about 124 lbs for a medium frame. However, body frame size, muscle mass, and age all influence where in that range you’ll be healthiest. Use our Ideal Weight Calculator for a personalized range.

    What is the ideal weight for a 5’5″ female?

    The ideal weight for a 5’5″ woman ranges from 114 to 150 lbs depending on body frame and composition. The mathematical average across all four standard formulas is approximately 128 lbs. If you’re athletic with significant muscle mass, you may weigh more than this and still be at an ideal body composition.

    Is BMI accurate for women?

    BMI is a useful screening tool but has significant limitations for women specifically. It doesn’t account for muscle mass, doesn’t differentiate fat distribution, and was developed using primarily male European population data. Women who are pregnant, postmenopausal, athletic, or of certain ethnicities may get misleading BMI readings. For a more accurate assessment, combine BMI with waist circumference, body fat percentage, and metabolic health markers.

    How much should a woman weigh at 5’2″?

    A woman at 5’2″ should generally weigh between 104–136 lbs to be within a healthy BMI range. The formula-calculated ideal is approximately 116 lbs for a medium-frame woman. Small-framed women may be perfectly healthy at 104–110 lbs, while large-framed women may be healthy up to 136 lbs.

    What is the most attractive weight for a woman?

    There isn’t one. Attractiveness is culturally and individually subjective, and it has nothing to do with a medical weight formula. What research does consistently show is that confidence, good posture, and physical vitality are universally associated with attractiveness none of which are determined by a specific number on a scale. Focus on your healthy weight range rather than an arbitrary aesthetic target.

    Does ideal weight change after menopause?

    Yes. After menopause, most women experience shifts in body composition losing lean muscle mass and gaining fat, particularly around the abdomen. The medical literature suggests that postmenopausal women may actually benefit from carrying slightly more weight than younger women. BMI ranges of 25–27 (technically “overweight”) are associated with lower mortality risk in women over 65 compared to BMI in the “normal” range. This is known as the “obesity paradox.”

    How do I know my body frame size?

    The simplest method is the wrist test: wrap your thumb and middle finger around your opposite wrist. If they overlap, you have a small frame. If they just touch, medium frame. If they don’t meet, large frame. For more precision, measure your wrist circumference with a tape measure and compare it to standardized charts based on your height. See the detailed measurement section above for specific numbers.

    What is the ideal weight for a woman who is 5’7″?

    A 5’7″ woman’s ideal weight ranges from approximately 121–159 lbs. The average of the four standard formulas puts the median at about 136 lbs. Women at this height who are physically active and carry more lean muscle may weigh 145–155 lbs and still be at a healthy body composition.

    Is 150 lbs overweight for a 5’3″ woman?

    By BMI calculation alone (BMI = 26.6), 150 lbs at 5’3″ falls into the “overweight” category. However, this depends heavily on body composition. A muscular, active woman at 150 lbs and 5’3″ may have a lower body fat percentage and better metabolic health markers than a sedentary woman at 130 lbs and the same height. If you’re concerned, evaluate the full picture: waist circumference, body fat percentage, blood panels, and how you feel physically.

    How much weight should a woman lose per week?

    Most health organizations recommend losing 0.5–2 lbs per week for sustainable, healthy weight loss. For most women, 0.5–1 lb per week is the most realistic and sustainable pace. More aggressive weight loss (over 2 lbs per week) often results in significant muscle loss, metabolic slowdown, nutrient deficiencies, and is much harder to maintain long-term.

    What is underweight for a 5’5″ woman?

    A BMI below 18.5 is classified as underweight. For a 5’5″ woman, this means weighing less than approximately 114 lbs. Being underweight can lead to nutritional deficiencies, weakened immune function, bone loss (osteoporosis), menstrual irregularity, fertility problems, and reduced ability to fight infections. If you’re below this range without intending to be, consult a healthcare provider.

    Does muscle weigh more than fat?

    A pound is a pound muscle doesn’t “weigh more” than fat in absolute terms. However, muscle is approximately 18% denser than fat, meaning one pound of muscle takes up significantly less space than one pound of fat. This is why two women at the same weight can look drastically different depending on their muscle-to-fat ratio. It’s also why the scale can go up when you start strength training while your body gets smaller and leaner.

  • Menstrual Cycle Calculator: How to Track Your Period, Predict Ovulation & Know When Your Next Period Is Due

    Menstrual Cycle Calculator: How to Track Your Period, Predict Ovulation & Know When Your Next Period Is Due

    You opened this page because you have questions. Maybe your period is late and you’re panicking. Maybe you want to figure out when you’ll ovulate next. Maybe you’re trying to get pregnant or trying to avoid it. Or maybe you’re just tired of being caught off guard every single month.

    Whatever brought you here, you’re in the right place. This guide covers everything you need to know about menstrual cycle calculators how they work, how accurate they actually are, how to use them for pregnancy planning, and what to do when the numbers don’t add up.

    No medical jargon overload. No judgment. Just real, clear information written the way a knowledgeable friend would talk to you.

    What Is a Menstrual Cycle Calculator?

    menstrual cycle calculator is a tool either online, in an app, or done manually that uses the date of your last period and the average length of your cycle to predict:

    • When your next period will start
    • Which days you are most likely fertile
    • When you are likely to ovulate
    • Whether your current period is late

    Think of it as a personalized calendar for your body. Instead of trying to hold all these dates in your head or counting backwards on a paper calendar, the calculator does the math instantly.

    These tools are especially valuable for people who:

    • Are trying to get pregnant and need to identify their fertile window
    • Are trying to avoid pregnancy and want to know their high-risk days
    • Experience irregular cycles and want to spot trends over time
    • Want to be prepared for their next period so it doesn’t catch them off guard
    • Are working with a doctor to track cycle-related symptoms

    How Does It Work?

    A menstrual cycle calculator relies on one foundational formula:

    Next period start date = First day of last period + Average cycle length

    If your last period started on February 1st and your average cycle is 28 days, your next period is predicted to start on March 1st.

    For ovulation, the standard estimate is:

    Ovulation day = First day of next period − 14 days

    This is because ovulation typically occurs approximately 14 days before your next period, regardless of your total cycle length.

    We’ll dig into both of these formulas in much more detail throughout this guide.

    How to Calculate Your Period Cycle The Basics

    Before any calculator can help you, you need to understand what exactly you’re measuring. The menstrual cycle is not the same as your period.

    Period vs. Menstrual Cycle: What’s the Difference?

    TermWhat It Means
    Period (menstruation)The days of actual bleeding typically 3 to 7 days
    Menstrual cycleThe full recurring process from the first day of one period to the first day of the next period

    Your menstrual cycle includes your period, but it also includes ovulation, the follicular phase, the luteal phase, and everything happening hormonally in between.

    How to Count Your Cycle Length

    Step 1: Mark the first day of your most recent period. This is Day 1 of your cycle.

    Step 2: Count every day forward until but not including the first day of your next period.

    Step 3: That total number is your cycle length.

    Example:

    • Period starts: January 5th (Day 1)
    • Next period starts: February 2nd
    • Count: Jan 5 → Feb 1 = 28 days
    • Cycle length = 28 days

    Finding Your Average Cycle Length

    One month’s data is rarely enough to make accurate predictions. Your cycle naturally varies slightly from month to month based on stress, sleep, diet, travel, illness, and hormonal fluctuations.

    To find your true average:

    1. Track your period start dates for 3 to 6 months minimum
    2. Calculate each cycle length using the method above
    3. Add all cycle lengths together
    4. Divide by the number of cycles tracked

    Example:

    • Cycle 1: 28 days
    • Cycle 2: 30 days
    • Cycle 3: 27 days
    • Total: 85 days ÷ 3 cycles = 28.3 days average

    Most online period calculators ask you for this average. If you haven’t tracked long enough to know, using 28 days as a starting estimate is reasonable for most people but remember it’s just an estimate.

    How to Calculate Your Next Period Date

    This is the most common thing people want to know. Here is the complete, step-by-step method.

    The Manual Calculation

    Formula: First day of last period + Your average cycle length = Predicted start of next period

    Step 1: Write down the date your last period started.
    Step 2: Add your average cycle length in days.
    Step 3: The resulting date is your predicted next period start date.

    Example with a 28-day cycle:

    • Last period started: February 10, 2026
    • Add 28 days
    • Predicted next period: March 10, 2026

    Example with a 32-day cycle:

    • Last period started: February 10, 2026
    • Add 32 days
    • Predicted next period: March 14, 2026

    Example with a 25-day cycle:

    • Last period started: February 10, 2026
    • Add 25 days
    • Predicted next period: March 7, 2026

    How Far Ahead Can You Predict?

    You can technically predict several months ahead using this method, but accuracy decreases with time. Most cycle tracking tools will project 3–6 months forward, but treat anything beyond the next cycle as a rough estimate only.

    Period Windows vs. Exact Dates

    Most good calculators don’t predict a single “day 1” date they predict a window of several days around the most likely start date. This is more realistic, because even in people with very regular cycles, the actual start can shift by 1–3 days compared to the prediction.

    Menstrual Cycle Length Calculator: What’s Actually Normal?

    One of the most anxiety-producing experiences is wondering whether your cycle length is “normal.” Here is what the research actually says.

    The Real Range of Normal Cycle Lengths

    The frequently quoted “28-day cycle” is an average, not a rule. The clinical definition of a normal menstrual cycle spans a wide range:

    • Shortest clinically normal cycle: 21 days
    • Longest clinically normal cycle: 35 days
    • Statistical average: 24–30 days (the 28-day figure comes from older population studies and overstates how common exactly 28-day cycles are)

    According to research published in the journal NPJ Digital Medicine using data from millions of app users, the most common cycle length is actually 29 days, and only about 13% of cycles are exactly 28 days long.

    Normal Variation Within Your Own Cycle

    It is completely normal for your cycle length to vary by 4–5 days from one month to the next. A person whose cycles range from 26 to 31 days month to month does not have an irregular cycle they have a typical cycle with normal natural variation.

    Clinically, a cycle is considered irregular when:

    • Cycles are consistently shorter than 21 days (called polymenorrhea)
    • Cycles are consistently longer than 35 days (called oligomenorrhea)
    • The variation between your shortest and longest cycle in a given year exceeds 7–8 days
    • Periods stop entirely for 3+ months in someone who is not pregnant or menopausal (called amenorrhea)

    How Period Length (Bleeding Duration) Differs from Cycle Length

    Your period length how many days you actually bleed is not the same as your cycle length. Most people bleed for 3 to 7 days, with 5 days being most common. Bleeding for 2 days or 8 days is within the range of normal for many people.

    Cycle length is counting all the days from the start of one period to the start of the next including the weeks between periods when you’re not bleeding at all.

    Is My Period Late? How to Know for Sure

    This section is for anyone who has been refreshing their calendar, anxiously waiting, and wondering: is my period actually late, or am I just stressed and miscounting?

    Defining “Late”

    Your period is technically considered late when it has not arrived within 7 days of your predicted start date. Before that 7-day window, most physicians would not classify the period as late just within the normal variation range.

    A period officially becomes a medical concern (called a missed period) when it does not arrive within 5–6 weeks of your last period’s start date.

    How to Use an “Is My Period Late?” Calculator

    An accurate “is my period late?” calculator works like this:

    1. Input your last period start date
    2. Input your average cycle length
    3. The tool calculates your predicted start date
    4. It then shows you how many days past that predicted date you currently are

    If the result shows you are 1–6 days past prediction, you are within the normal variation zone. If it shows 7 or more days past prediction, your period is considered late.

    Most Common Reasons a Period is Late (That Aren’t Pregnancy)

    Before you spiral, here are the most common non-pregnancy reasons a period runs late:

    Stress This is the number one culprit. Psychological stress activates the HPA (hypothalamic-pituitary-adrenal) axis, which can suppress the hormonal signals that trigger ovulation. No ovulation = delayed or missed period.

    Significant weight changes  Rapid weight loss, extreme calorie restriction, or dramatic weight gain can all disrupt the hormonal balance required for regular ovulation.

    Intense exercise  Athletes and people who recently dramatically increased their exercise load sometimes experience delayed or missed periods (called exercise-induced amenorrhea).

    Illness A significant illness even a bad flu in the weeks before your expected period can shift your cycle.

    Travel and schedule disruption Crossing multiple time zones, dramatically changing sleep schedules, or major routine disruptions can affect cycle timing.

    Hormonal changes Coming off hormonal birth control, including the pill, hormonal IUD, implant, or injection, can cause irregular cycles for several months while your body recalibrates.

    Thyroid dysfunction Hypothyroidism (underactive thyroid) and hyperthyroidism (overactive thyroid) are both associated with irregular, late, or missing periods.

    PCOS (Polycystic Ovary Syndrome)  A hormonal condition affecting 6–12% of people with uteruses, characterized by irregular or absent ovulation and therefore irregular cycles.

    Perimenopause  If you are in your late 30s or 40s, your cycles may begin to lengthen and become irregular as you approach the perimenopausal transition.

    When to Take a Pregnancy Test

    If your period is 7 or more days late and you have had unprotected sex since your last period, taking a pregnancy test is the most reliable way to rule in or rule out pregnancy. Modern urine pregnancy tests can detect the pregnancy hormone hCG with high accuracy from the first day of a missed period.

    A negative result when your period is significantly late but you’ve had unprotected sex should ideally be repeated 1 week later, as hCG levels in very early pregnancy can sometimes fall below home test detection thresholds.

    How to Calculate Menstrual Cycle and Ovulation

    Understanding ovulation is where period tracking becomes genuinely powerful both for those trying to conceive and those wanting to understand their own hormonal health.

    What Is Ovulation?

    Ovulation is the release of a mature egg from one of your ovaries. This egg travels down the fallopian tube toward the uterus. If it is fertilized by sperm during this journey, pregnancy can occur. If it is not fertilized, the egg disintegrates, progesterone drops, and your uterine lining sheds beginning your next period.

    Ovulation only lasts 12 to 24 hours that’s how long the egg survives if unfertilized. However, sperm can survive in the reproductive tract for up to 5 days, which means your actual fertile window spans approximately 6 days: the 5 days before ovulation plus the day of ovulation itself.

    The Standard Ovulation Formula

    The most commonly used ovulation estimate is:

    Ovulation day ≈ Cycle length − 14

    This works backward from your next predicted period, because the luteal phase (the time between ovulation and your next period) is relatively consistent at approximately 14 days for most people, regardless of total cycle length.

    Examples:

    Cycle LengthPredicted Ovulation DayFertile Window
    21 daysDay 7Days 2–7
    24 daysDay 10Days 5–10
    28 daysDay 14Days 9–14
    30 daysDay 16Days 11–16
    35 daysDay 21Days 16–21

    Important: Day 1 always refers to the first day of your period (the first day of actual bleeding, not spotting).

    The Limits of Calculator-Based Ovulation Prediction

    The cycle-length-minus-14 formula assumes your luteal phase is consistently 14 days. In reality, luteal phase length varies between people (typically 10–16 days) and can vary within the same person from cycle to cycle. This means calculator predictions for ovulation can be off by several days.

    For people trying to conceive, ovulation predictor kits (OPKs)  which detect the LH (luteinizing hormone) surge that precedes ovulation by 24–36 hours provide significantly more accurate real-time ovulation detection than calendar calculations alone.

    Physical Signs of Ovulation to Watch For

    Your body provides several observable signals around ovulation:

    Cervical mucus changes  In the days approaching ovulation, cervical discharge typically becomes more abundant, clearer, and stretchy often described as resembling raw egg whites. This “fertile-quality” mucus is one of the most reliable cycle signs.

    Basal body temperature (BBT) shift  Your resting body temperature (taken immediately upon waking, before any activity) rises by approximately 0.2°C to 0.5°C after ovulation due to progesterone production. Tracking BBT over multiple cycles can help identify when ovulation is occurring.

    Mittelschmerz  Some people experience a brief, one-sided cramping or twinges of pain in the lower abdomen around ovulation. “Mittelschmerz” is German for “middle pain,” referring to the middle of the cycle.

    Breast tenderness  Breasts may feel more sensitive or slightly tender in the days around and following ovulation.

    Heightened libido  Many people notice a natural increase in sexual drive in the days surrounding ovulation an evolutionary mechanism that makes biological sense.

    Menstrual Cycle Calculator for Pregnancy

    If you are trying to get pregnant, a menstrual cycle calculator becomes one of your most practical tools. Here is how to use it effectively.

    Identifying Your Fertile Window

    Your fertile window is the roughly 6-day period during which unprotected sex can result in pregnancy: the 5 days before ovulation and the day of ovulation itself. Having sex during this window particularly in the 2–3 days immediately before ovulation gives you the highest probability of conception.

    A menstrual cycle calculator for pregnancy will display:

    • Your ovulation date estimate (based on cycle length minus 14)
    • Your fertile window (typically marked as several days around ovulation)
    • The best days to try to conceive (usually highlighted in the 2–3 days before and including ovulation day)

    Why Sex Before Ovulation Matters

    Counterintuitive as it sounds, having sex before ovulation is often more effective for conception than waiting until ovulation day itself. This is because:

    • Sperm can survive in the reproductive tract for up to 5 days
    • Having sperm already present when the egg is released maximizes the chances of fertilization
    • Pinpointing the exact ovulation day is difficult even with calculators, so having sperm in place before and during the window increases the probability window

    Using a Menstrual Cycle Calculator for Pregnancy Planning Step-by-Step

    Step 1: Input your last period start date and average cycle length into the calculator.

    Step 2: Review your predicted ovulation date and fertile window.

    Step 3: Aim to have sex every 1–2 days during the fertile window, with emphasis on the 2–3 days before predicted ovulation.

    Step 4: After ovulation, the two-week wait begins. If your period does not arrive at the predicted time, take a pregnancy test.

    Step 5: Track multiple cycles. If conception does not occur after 6–12 months of timed intercourse, consult a reproductive endocrinologist or OB-GYN.

    Menstrual Cycle Calculator and Pregnancy Due Date Calculation

    Once pregnancy is confirmed, the same cycle data is used to estimate your due date (EDD estimated due date). The standard calculation method used by OBs and midwives is Naegele’s Rule:

    Due date = First day of last period + 280 days (40 weeks)

    Alternatively: Take the first day of your last period, subtract 3 months, add 7 days.

    Example:

    • Last period: September 1, 2025
    • Subtract 3 months: June 1, 2025
    • Add 7 days: June 8, 2026 (estimated due date)

    Your healthcare provider will likely confirm or adjust this estimate using an early ultrasound, which measures fetal size to more accurately date the pregnancy.

    A Note for Those With PCOS or Irregular Cycles Trying to Conceive

    Standard menstrual cycle calculators assume ovulation happens predictably at cycle length minus 14 days. For people with PCOS or significantly irregular cycles, ovulation may not be occurring at all, or may occur at highly unpredictable times. In these cases, the calculator is a helpful starting point, but working with a gynecologist who may recommend cycle monitoring via ultrasound, blood tests, or ovulation induction medications produces much better outcomes.

    How Accurate Are Period Calculators?

    This is honestly one of the most important questions on this page, and too many sites gloss over it. Let’s be direct.

    What Period Calculators Do Well

    Period calculators are reliable for:

    • Giving you a reasonable estimate of when your next period will arrive
    • Helping you plan ahead for travel, events, or scheduling
    • Identifying approximate fertile windows for period tracking
    • Providing a starting point for conversations with your healthcare provider

    The Accuracy Reality

    A 2020 study published in PLOS ONE analyzed the predictive accuracy of menstrual cycle apps and found that the average prediction error for period start date was approximately 3–4 days in people with regular cycles. In people with irregular cycles, the error could be significantly larger.

    A review published in the BMJ Sexual & Reproductive Health found that no currently available app-based fertility tracking method alone meets the threshold of reliability required as a standalone contraceptive method.

    What this means practically:

    • For period planning and general awareness: Period calculators are quite useful
    • For identifying fertile windows for pregnancy planning: Calculators are a good starting framework, best combined with OPKs or BBT tracking
    • For contraception: Calculators alone are not a reliable contraceptive method and should not be used as the sole means of preventing pregnancy

    Factors That Reduce Calculator Accuracy

    • Short tracking history  Using only 1–2 months of data for averaging
    • Recent hormonal changes  Coming off birth control, recent pregnancy or miscarriage, breastfeeding
    • Health changes  New medications, thyroid issues, significant weight changes
    • Age-related changes Cycle patterns naturally shift in the late teens and early 20s (still regularizing) and again in the late 30s and 40s (perimenopause)
    • Inconsistent tracking  Entering approximate dates rather than precise first-day-of-bleeding dates

    Menstrual Cycle Calculator App What to Look For

    There are dozens of period tracking apps on the market. Here is what to look for when choosing one.

    Essential Features in a Good Period Tracker App

    Accurate period and symptom logging
    Look for apps that allow you to log the exact start and end dates of each period, flow intensity (light/medium/heavy), and associated symptoms (cramps, headaches, mood, energy). The more data the app can collect, the more accurate its predictions become over time.

    Cycle history and trend visualization
    Good apps show you your historical cycle data in a clear visual format cycle length trends over time, period duration patterns, and prediction accuracy history. This is how you build genuine self-knowledge.

    Ovulation and fertile window prediction
    The app should clearly display your estimated ovulation date and fertile window, ideally with transparency about how it’s calculating these (algorithm-based vs. random prediction).

    Symptom and mood tracking
    Tracking premenstrual symptoms (PMS), mood patterns, energy levels, and pain alongside your cycle can reveal important health patterns and gives you incredibly useful information to share with a doctor.

    Reminders and period countdown
    Practical alerts for your upcoming period, fertile window, and medication reminders (if relevant) are quality-of-life features that make real-world use smoother.

    Data privacy and security
    Given the sensitive nature of reproductive health data, carefully review each app’s privacy policy. After the overturning of Roe v. Wade in the United States in 2022, reproductive health data privacy became a serious concern. Look for apps that:

    • Store data locally on your device rather than on servers
    • Have clear, explicit policies about not sharing data with third parties
    • Are headquartered in jurisdictions with strong data privacy laws
    • Offer data deletion options

    Clue
    One of the most scientifically rigorous period tracking apps available. Built in collaboration with reproductive health researchers. Does not sell user data. Available for iOS and Android. Offers detailed symptom tracking, cycle insights, and a premium subscription for advanced features. Excellent for people who want evidence-based predictions and strong privacy protection.

    Flo
    One of the most widely downloaded period trackers globally. Offers comprehensive health tracking beyond just periods including sleep, nutrition, and fitness. Has AI-powered period predictions. Premium subscription required for many features. Has faced scrutiny over data privacy practices in the past; users should review their current privacy policy.

    Apple Health (Period Tracking)
    Built into iPhones, Apple’s health app includes solid cycle tracking that integrates with the Apple Watch for additional biometric data. Processes health data on-device rather than in the cloud, making it one of the stronger options for privacy. Works well for those already in the Apple ecosystem.

    Natural Cycles
    The only FDA-cleared digital contraceptive app. Uses BBT combined with period tracking for fertility awareness. Has stricter scientific validation than most apps. Requires consistent BBT tracking. Suitable for pregnancy planning and per FDA clearance contraception use (though effectiveness depends on consistent, correct use).

    Ovia Fertility
    Particularly designed for people trying to conceive. Provides detailed fertility window predictions, conception tips, and integrates with OPK data. Strong community support features.

    Irregular Periods and Calculators

    If your periods are irregular, you may feel like period calculators are useless for you. Here is a more nuanced take.

    What Counts as an Irregular Cycle?

    An irregular menstrual cycle is one where the cycle length varies by more than 7–8 days between your shortest and longest cycle in a given year, or where cycles are consistently outside the 21–35 day range.

    Irregular periods are extremely common estimates suggest 14–25% of people who menstruate experience some degree of cycle irregularity.

    Can You Use a Calculator with Irregular Cycles?

    Yes, but with important caveats.

    A menstrual cycle calculator can still serve you well with irregular cycles if you:

    1. Track a longer history 6–12 months of data gives a more meaningful picture than 2–3 months
    2. Look at your range, not just your average  If your cycles range from 24 to 36 days, the calculator should show you the earliest and latest possible period dates, not just one predicted date
    3. Use it for general awareness, not precise prediction Think of the calculator as widening your awareness window, not pinpointing an exact day
    4. Supplement with physical signs  Cervical mucus changes and OPKs are more reliable for detecting ovulation than calendar math when cycles are irregular

    Common Causes of Irregular Periods

    Understanding why your cycles are irregular is more important than simply adapting to the irregularity. Common causes include:

    Polycystic Ovary Syndrome (PCOS)  A hormonal condition where high androgen levels interfere with regular ovulation. Affects roughly 1 in 10 people who menstruate and is one of the most common causes of irregular cycles.

    Thyroid disorders:  Both hypothyroidism and hyperthyroidism can disrupt the hormonal cascade that regulates the menstrual cycle. A simple blood test (TSH level) can rule this in or out.

    Endometriosis:A condition where tissue similar to the uterine lining grows outside the uterus. Often associated with painful, heavy, or irregular periods.

    Hyperprolactinemia: Elevated prolactin levels (sometimes caused by a small, benign pituitary tumor called a prolactinoma) can suppress ovulation and cause irregular or absent periods.

    Eating disorders and extreme dieting, Very low body weight or extremely restricted calorie intake can suppress the hypothalamic signaling needed for regular ovulation.

    Stress: Chronic psychological stress elevates cortisol, which can suppress GnRH (gonadotropin-releasing hormone) production and disrupt cycle regularity.

    Perimenopause : Natural hormonal transition beginning in the late 30s to mid-40s, during which cycles naturally become more variable before eventually ceasing.

    Common Reasons Your Period Doesn’t Match the Calculator

    You entered your data carefully. You used the right dates. But your period showed up 5 days early or it’s now been 2 weeks past the prediction. Here is why that happens.

    The Calculator Was Always an Estimate

    This sounds obvious but is worth emphasizing: period calculators predict based on averages of your past cycles. They have no way to account for what happened this specific cycle that might have shifted things.

    Stress and Cortisol

    Stress is the most common explanation for an unexpected cycle shift, especially a delayed period. A stressful event a job loss, relationship conflict, exam period, illness in a family member during the follicular phase (before ovulation) can delay ovulation, which in turn pushes the entire period later.

    Illness

    A significant illness particularly fever in the weeks leading up to ovulation can delay it. This is your body’s protective mechanism prioritizing recovery over reproduction.

    Travel Across Time Zones

    International travel and jet lag have been associated with menstrual cycle disruption, possibly through disruption of circadian rhythms that interact with reproductive hormone cycles.

    Intense New Exercise Regime

    Starting a dramatically more intense exercise program can cause delayed ovulation, particularly if combined with energy restriction (eating less while training more).

    Weight Fluctuations

    Significant weight changes in either direction rapid weight loss or weight gain can alter estrogen levels and disrupt the pattern your calculator was trained on.

    The Calendar Just Has Normal Variation

    Sometimes your period is a few days early or late for no specific identifiable reason simply the natural variation of biological processes. This is completely normal and not a cause for concern unless it becomes a consistent pattern.

    Tracking Your Cycle: Beyond the Calculator

    Calendar-based tracking is just one layer. If you want a real, comprehensive understanding of your cycle, these additional methods add depth and accuracy.

    Basal Body Temperature (BBT) Charting

    Basal body temperature is your resting temperature taken first thing in the morning, before getting out of bed, talking, or drinking anything. After ovulation, progesterone causes a slight but measurable rise in BBT (approximately 0.2–0.5°C / 0.4–1.0°F) that persists until your next period.

    By charting your BBT daily over several months, you can:

    • Confirm that ovulation occurred (retrospectively)
    • Identify your cycle’s typical ovulation timing pattern
    • Detect luteal phase issues (a luteal phase shorter than 10 days may indicate difficulty sustaining a pregnancy)

    You need a basal body thermometer  a standard fever thermometer is not precise enough. Temperature must be taken at the same time each morning after at least 3 consecutive hours of sleep.

    Cervical Mucus Observation (Billings Method / Creighton Model)

    Monitoring your cervical mucus (vaginal discharge changes) throughout your cycle is one of the most researched fertility awareness methods. The key pattern:

    • Menstruation (Days 1–5 typically): Bleeding
    • Dry days (post-period, pre-fertile): Little or no discharge
    • Sticky/creamy mucus: Approaching fertile window; not yet peak fertility
    • Egg-white cervical mucus (EWCM): Highly fertile clear, stretchy, resembling raw egg white. This coincides with peak fertility.
    • Return to dry or thick: Post-ovulation; fertility is declining

    Tracking these patterns alongside your calendar data significantly improves both the accuracy of fertility awareness and the depth of your cycle understanding.

    Ovulation Predictor Kits (OPKs)

    OPKs detect the LH surge  the hormonal spike that precedes ovulation by approximately 24–36 hours. They are urine-based tests used similarly to pregnancy tests.

    How to use them:

    • Start testing approximately 4–5 days before your predicted ovulation day
    • Test at the same time each day (mid-morning to early afternoon is often recommended not first morning urine, as LH surges typically begin in the early morning and appear in urine a few hours later)
    • positive OPK (test line as dark as or darker than control line) indicates ovulation is likely within 24–36 hours
    • Digital OPKs display a smiley face for easy reading

    OPKs are particularly valuable for people with irregular cycles, people trying to conceive, or anyone wanting to confirm the calculator’s ovulation prediction.

    Period Tracking Journals

    Some people find that a handwritten tracking journal noting period start/end dates, flow intensity, symptoms, mood, energy, and lifestyle factors creates a more personal and reflective connection to their cycle data than any app. There is no technology required, all data stays private, and the act of writing can itself be valuable.

    When to See a Doctor

    This is a YMYL topic meaning genuinely important health decisions can be influenced by what you read here. Please do not use any calculator or tool as a substitute for professional medical evaluation when the following situations apply.

    See a Doctor If:

    Your periods have been consistently absent for 3+ months and you are not pregnant, not breastfeeding, and not approaching menopause. This is called secondary amenorrhea and requires medical investigation.

    Your periods are consistently very heavy  soaking through a pad or tampon every hour for several consecutive hours, passing clots larger than a quarter, or experiencing significant fatigue suggesting blood loss anemia. This can indicate fibroids, endometrial polyps, adenomyosis, blood clotting disorders, or other conditions.

    Your periods are consistently extremely painful  cramps so severe they interfere with school, work, or daily activities; pain that doesn’t respond to over-the-counter pain relief. This may indicate endometriosis, which is significantly underdiagnosed and benefits greatly from early intervention.

    Your cycle has suddenly become irregular after a period of regular cycles, with no obvious lifestyle explanation.

    You have not had a period by age 16 (primary amenorrhea). This requires evaluation regardless of symptoms.

    You have been trying to conceive for 12 months (or 6 months if you are over 35) without success. This is the standard referral threshold for fertility evaluation.

    You have significant PMS or PMDD  premenstrual symptoms (mood changes, depression, anxiety, physical pain) severe enough to regularly disrupt your functioning may be treatable, and a doctor can help.

    Your period is more than 6 weeks late and pregnancy tests are negative. This warrants blood work to check hormone levels, thyroid function, and other potential causes.

    A Note for Young People

    If you are a teenager or in your early 20s reading this: cycles in the first few years after your first period (menarche) are often naturally irregular as your hormonal system matures. Cycles in the range of 21–45 days are considered normal in the first 2 years post-menarche. This does not mean you should ignore significant pain, very heavy bleeding, or prolonged absence of periods those warrant evaluation at any age. But mild irregularity in the early reproductive years is often normal and does not necessarily indicate a problem.

    Using Our Menstrual Cycle Calculator

    Our Menstrual Cycle Calculator tool on this page makes all of the calculations above simple and instant. Here is how to use it:

    Step 1 — Enter your last period start date: Select the first day of actual bleeding from your most recent period. If you had spotting before full flow, use the first day of proper bleeding.

    Step 2 — Enter your average cycle length: If you know it, enter your historical average. If you’re unsure, the default of 28 days is a reasonable starting estimate that you can refine over time.

    Step 3 — Enter your average period length (optional): This helps the tool show your expected period duration window, not just the start date.

    Step 4 — Review your results: The calculator will show you:

    • Your predicted next period start date
    • Your predicted fertile window
    • Your estimated ovulation date
    • How many days until your next period
    • Whether your current period is on time, approaching, or late

    Tip: Use the calculator for multiple upcoming months to plan ahead. And remember the more tracking history you input, the more accurate your predictions become.

    The Bottom Line

    Your menstrual cycle is one of the most informative windows into your overall health. Irregular patterns, changes in flow, new or worsening symptoms, and cycle shifts can all signal changes in your body that are worth paying attention to and sometimes worth discussing with a doctor.

    menstrual cycle calculator is a genuinely useful tool. It helps you prepare for your period, identify your fertile window, understand your own patterns, and have more informed conversations with your healthcare provider. It cannot, however, account for the full complexity of human physiology and it should never replace professional medical advice when something doesn’t feel right.

    Use the calculator. Track your cycle. Learn your body. And don’t hesitate to seek care when you need it.

     FAQs

    How do I calculate my next period date?

    To calculate your next period date, take the first day of your most recent period and add your average cycle length in days. For example, if your last period started on February 5 and your average cycle is 28 days, your next period is predicted to start on March 5. If you don’t know your average cycle length, track your period start dates for 3–6 months, calculate the length of each cycle (from Day 1 of one period to Day 1 of the next), then average those numbers.

    How accurate is a period calculator?

    Period calculators are reasonably accurate for people with regular cycles research shows prediction errors of about 3–4 days on average for regular cycles. For people with irregular cycles, accuracy decreases significantly. They are best used as planning guides, not precise predictions. They are especially unreliable as a contraceptive method alone.

    Is my period late if it hasn’t come on the predicted date?

    Not necessarily. A period arriving 1–6 days after the predicted date is typically within normal variation range. A period is considered late at 7+ days past prediction. A period is considered missed when it hasn’t arrived within 5–6 weeks of your last period start date. Common causes of a late period beyond pregnancy include stress, illness, travel, weight changes, and thyroid issues.

    What is a normal menstrual cycle length?

    A normal menstrual cycle ranges from 21 to 35 days, with most people falling between 24 and 30 days. The often-cited 28-day figure is a statistical average, not a standard every person should meet. Your own cycle length can vary by 4–5 days from month to month and still be completely normal.

    How do I calculate my ovulation date?

    The most common method is to subtract 14 days from your expected next period date. For example, if your next period is expected on March 28, your estimated ovulation date is March 14. Your fertile window spans approximately 5 days before ovulation through ovulation day. For more precise results, combine this calculation with ovulation predictor kits (OPKs) and cervical mucus observation.

    Can a period calculator help me get pregnant?

    Yes. A menstrual cycle calculator for pregnancy identifies your estimated fertile window and ovulation date, helping you time intercourse for maximum conception chances. The most effective days to try are typically 1–3 days before ovulation. For better accuracy, supplement calculator predictions with ovulation predictor kits, which detect the LH hormone surge preceding ovulation.

    Why is my period calculator wrong sometimes?

    Period calculators can be off because they are based on averages of past cycles, but individual cycles vary. Stress, illness, travel, significant exercise changes, hormonal shifts, and medications can all cause any particular cycle to differ from your average. The calculator has no way to account for real-time biological changes, which is why it functions best as a planning estimate rather than a precise guarantee.

    How many days after my period can I get pregnant?

    Pregnancy is theoretically possible from any unprotected sex, because sperm can survive in the reproductive tract for up to 5 days and ovulation timing can vary. However, the highest pregnancy probability occurs during the 6-day fertile window the 5 days before ovulation and ovulation day itself. For most people with 28-day cycles, this is roughly days 9–14 of the cycle. For longer or shorter cycles, use the cycle-length-minus-14 formula to estimate when this window occurs for you specifically.

    What is the difference between menstrual cycle and period?

    Your period is the days of actual bleeding, typically lasting 3–7 days. Your menstrual cycle is the entire recurring hormonal and physical process from the first day of one period to the first day of the next, including all the hormonal activity, follicle development, ovulation, and uterine lining changes that happen between periods. Your cycle length includes both your period days and the non-bleeding days in between.

    How do I track my period cycle if it’s irregular?

    For irregular cycles, track a longer data history (6–12 months minimum), note your range of cycle lengths rather than relying solely on an average, and pair calendar tracking with physical signs like cervical mucus observation and ovulation predictor kits. Apps like Clue specifically have algorithms designed to handle irregular cycle ranges more appropriately than simple average-based tools.

    Can stress delay my period?

    Yes. Stress is one of the most common causes of a delayed period. Psychological stress activates the HPA (hypothalamic-pituitary-adrenal) axis, which can suppress the GnRH (gonadotropin-releasing hormone) signal from the hypothalamus. Without adequate GnRH signaling, the LH surge needed for ovulation may be delayed or absent, pushing your period later.

    What is the best free period tracker app?

    Clue is widely regarded as one of the best free period tracker apps for its scientific accuracy, privacy practices (no data selling), and comprehensive symptom tracking. Apple Health’s built-in period tracking is excellent for iPhone users and prioritizes on-device data processing. For those specifically trying to conceive, Ovia Fertility offers strong features. Natural Cycles is FDA-cleared for contraceptive use but is a paid subscription.

  • Period Calculator: Your Complete Guide to Tracking Menstrual Cycles and Ovulation

    Period Calculator: Your Complete Guide to Tracking Menstrual Cycles and Ovulation

    Understanding your menstrual cycle is essential for reproductive health, family planning, and overall well-being. A period calculator helps you predict when your next period will arrive, identify your fertile window, and monitor cycle patterns over time. Whether you’re trying to conceive, avoid pregnancy, or simply stay prepared, tracking your menstrual cycle provides valuable insights into your body’s natural rhythm.

    In this comprehensive guide, we’ll explore how to use a period calculator effectively, understand menstrual cycle phases, and leverage tools like an ovulation calculator to take control of your reproductive health.

    What Is a Period Calculator and How Does It Work?

    A period calculator is a digital tool that predicts your next menstrual period based on your previous cycle data. By entering the first day of your last period and your average cycle length, the calculator estimates when your next period will begin.

    Key Data Points for Accurate Period Tracking

    To get the most accurate predictions from a menstrual cycle calculator, you’ll need:

    • First day of your last period: This marks day one of your cycle
    • Average cycle length: The number of days from the first day of one period to the first day of the next (typically 21-35 days)
    • Period duration: How many days your bleeding typically lasts

    A period tracker uses this information to create a personalized period calendar that shows your expected period dates, fertile window, and ovulation day.

    Period-calculator-guide

    Understanding Menstrual Cycle Phases

    Your menstrual cycle consists of distinct hormonal phases that prepare your body for potential pregnancy each month. Understanding menstrual cycle phases helps you recognize what’s happening in your body and why symptoms vary throughout the month.

    The Four Phases of Your Menstrual Cycle

    1. Menstrual Phase (Days 1-5) This is when bleeding occurs. The normal period duration ranges from 3-7 days, with most women experiencing 3-5 days of flow.

    2. Follicular Phase (Days 1-13) Overlapping with menstruation, this phase involves rising estrogen levels as your ovaries prepare to release an egg.

    3. Ovulation Phase (Day 14) An ovulation calculator helps identify this crucial 24-hour window when your ovary releases a mature egg. This is your most fertile time.

    4. Luteal Phase (Days 15-28) After ovulation, progesterone levels rise to prepare the uterine lining. If pregnancy doesn’t occur, hormone levels drop, triggering your next period.

    A period cycle chart visualizes these phases, making it easier to understand your body’s patterns.

    How to Calculate Your Period Cycle

    Many women wonder how to calculate period cycle length accurately. Here’s a simple method:

    Manual Period Cycle Calculation

    1. Mark the first day of your period (day 1)
    2. Count each day until the day before your next period starts
    3. The total number is your menstrual cycle length
    4. Track 3-6 cycles to find your average

    Using a Menstrual Cycle Tracker

    An online period tracker automates this process by:

    • Storing your cycle history
    • Calculating average cycle length
    • Predicting future periodsPeriod Calculator vs. Ovulation Calculator: What’s the Difference?
    • While often used together, these tools serve different purposes:

      Period Calculator Functions
    • A period calculator focuses on:
    • Predicting menstrual start dates
    • Tracking cycle regularity
    • Monitoring period symptoms
    • Planning around your cycle
    • Identifying patterns or irregularities

    Ovulation Calculator Benefits

    An ovulation calculator specifically identifies:

    • Your fertile window (typically 5-6 days)
    • Peak fertility days
    • Best timing for conception
    • Safe period calculator for natural family planning

    Many comprehensive tools combine both features, allowing you to calculate ovulation and period dates simultaneously. This integration is particularly valuable for women using natural family planning methods or trying to conceive.


    What Is a Normal Menstrual Cycle?

    If you’ve wondered “what is a normal menstrual cycle?” – the answer varies more than you might think.

    Normal Menstrual Cycle Length

    Period length: 3-7 days of bleeding

    Average cycle: 28 days (but anywhere from 21-35 days is normal)

    Variation: Cycles can vary by 2-3 days month to month

    How Many Days Between Periods Is Normal?

    How many days between periods is normal depends on your individual cycle. While 28 days is average, regular cycles can range from 21-40 days. Consistency matters more than matching the “average” – if your cycle is consistently 25 days or 32 days, that’s normal for you.

    Use a menstrual cycle tracker to identify your personal pattern and detect any significant changes.

    Advanced Features Worth Considering

    • Irregular period calculator for unpredictable cycles
    • Late period calculator with pregnancy probability
    • Medication and birth control tracking
    • Partner sharing for family planning
    • Health report exports for medical appointments

    An accurate period calculator paired with comprehensive tracking creates a powerful menstrual cycle app that becomes more precise over time

    How to Track Period Cycle for Irregular Cycles

    Women with irregular cycles often ask how to track period cycle when predictions are unreliable. Here’s how:

    Strategies for Irregular Cycle Tracking

    1. Track consistently: Even irregular patterns reveal information over time
    2. Log symptoms: Spotting, cramping, and cervical mucus changes provide clues
    3. Use an irregular period calculator: Specialized algorithms handle variability better
    4. Monitor additional factors: Stress, weight changes, and lifestyle factors
    5. Consult healthcare providers: Share your menstrual calculator data for better diagnosis

    An irregular period calculator uses statistical modeling to provide probability ranges rather than exact dates, which is more helpful for unpredictable cycles.

    How to Calculate Menstrual Cycle Length Accurately

    Learning how to calculate menstrual cycle length properly ensures better predictions:

    Step-by-Step Calculation

    Calculate average: Add all cycle lengths and divide by the number of cycles

    Identify Day 1: The first day of full menstrual flow (not spotting)

    Count forward: Include every day until the day before your next period

    Record the number: This is one complete cycle length

    Repeat for 3-6 months: Track multiple cycles

    Fertility Calculator: Understanding Your Fertile Window

    A fertility calculator is essential for women trying to conceive or practicing natural family planning.

    How Fertility Calculators Work

    Your fertile window includes:

    • 5 days before ovulation
    • Ovulation day itself
    • 1 day after ovulation

    Sperm can survive up to 5 days in the female reproductive tract, making the days leading up to ovulation crucial for conception.

    Safe Period Calculator for Natural Family Planning

    A safe period calculator identifies days when pregnancy is least likely to occur. However, this method has limitations:

    • Only effective with regular cycles
    • Requires consistent tracking
    • Has a typical use failure rate of 12-24%
    • Not suitable for preventing sexually transmitted infections

    For reliable contraception, consult healthcare providers about additional methods.

    Using a Period Calendar for Better Planning

    A period calendar offers practical benefits beyond health tracking:

    Lifestyle Planning

    • Schedule important events around your cycle
    • Plan vacations when you won’t be menstruating
    • Prepare for energy fluctuations
    • Anticipate mood changes

    Health Monitoring

    • Detect changes in normal period duration
    • Identify potential health issues early
    • Track symptoms related to conditions like PCOS or endometriosis
    • Provide accurate information to healthcare providers

      Period Due Date Calculator: When to Expect Your Next Period
    • A period due date calculator answers the common question: “when is my next period?”

      Factors Affecting Period Prediction Accuracy
    • Cycle regularity: Regular cycles = more accurate predictions
    • Data history: More tracked cycles = better accuracy
    • Recent changes: Stress, illness, or lifestyle changes can shift timing
    • Age factors: Perimenopause causes increasing irregularity
    • For women with consistent cycles, an accurate period calculator can predict within 1-2 days. Those with variable cycles should use a late period calculator that provides probability ranges.

    Tips for Effective Period Tracking

    Maximize the benefits of your menstrual cycle calculator with these strategies:

    Best Practices

    1. Track from day one: Start with your next period for immediate benefits
    2. Log consistently: Daily entries improve accuracy
    3. Record symptoms: Track flow, cramps, mood, and energy levels
    4. Update cycle length: Adjust if you notice changes
    5. Review patterns: Check your period cycle chart monthly
    6. Share with healthcare providers: Export data for medical appointments

    FAQs

    Q: How accurate is a period calculator?

    A: For women with regular cycles (varying by less than 3 days), a period calculator is typically accurate within 1-2 days. Accuracy improves with more tracked cycles. Irregular cycles reduce prediction accuracy.

    Q: Can I use an ovulation calculator if I have irregular periods?

    A: Yes, but predictions will be less reliable. Track ovulation signs like basal body temperature and cervical mucus alongside an ovulation calculator for better accuracy with irregular cycles.

    Q: What is the average menstrual cycle length?

    A: The average menstrual cycle is 28 days, but normal cycles range from 21-35 days. Your personal “normal” is what’s consistent for you, even if it differs from the average.

    Q: How do I calculate when my next period is due?

    A: Add your average cycle length to the first day of your last period. For example, if your cycle is 30 days and your last period started on the 1st, your next period should start around the 31st.

    Q: Is a period tracker app better than a paper calendar?

    A: Digital period trackers offer automated calculations, pattern recognition, symptom logging, and portability that paper calendars can’t match. They also become more accurate over time as they learn your patterns.

    Q: What should I do if my period is late according to my calculator?

    A: If your period is 5-7 days late and you’re sexually active, take a pregnancy test. If negative and your period hasn’t started after 2 weeks, consult a healthcare provider to rule out other causes.

    Q: Can stress affect my period calculator predictions?

    A: Yes. Stress can delay ovulation, which lengthens your cycle and makes predictions less accurate. Note stressful periods in your tracker to understand pattern changes.

    Q: How many days of period bleeding is normal?

    A: Normal period duration is 3-7 days, with most women bleeding for 3-5 days. Bleeding for less than 2 days or more than 7 days warrants discussion with a healthcare provider.

  • The Ultimate Guide to Using a Body Shape Calculator for Health and Style

    The Ultimate Guide to Using a Body Shape Calculator for Health and Style

    Introduction: Why the Scale Is No Longer Enough

    For decades, Body Mass Index (BMI) has been used as a shortcut for evaluating health. While convenient, BMI is blunt, it compares weight to height but ignores fat distribution, muscle mass, bone density, and metabolic risk.

    Modern health science now favors geometric body shape analysis, which examines how fat and mass are distributed across the body. This is where a Body Shape Calculator guide becomes invaluable.

    Rather than asking “How much do you weigh?”, it asks a more meaningful question:

    “Where does your body store mass, and what does that mean for your health and appearance?”

    What Is a Body Shape Calculator?

    A Body Shape Calculator analyzes proportional relationships between key circumference measurements such as:

    • Shoulders
    • Bust or chest
    • Waist
    • Hips

    Using mathematical thresholds and ratios, it categorizes the body into standardized silhouettes. These classifications are used in:

    • Preventive health screening
    • Metabolic risk assessment
    • Ergonomic and orthopedic analysis
    • Fashion and garment engineering

    Unlike BMI, body shape analysis reflects how the body actually functions.

    Why Your Body Shape Matters

    1. Health Perspective: Visceral Fat vs. Subcutaneous Fat

    Fat location is a stronger predictor of disease risk than total body weight.

    Visceral Adipose Tissue (VAT)

    • Stored deep inside the abdomen
    • Surrounds vital organs (liver, pancreas, heart)
    • Acts as an endocrine organ
    • Releases inflammatory compounds linked to:
      • Type 2 diabetes
      • Cardiovascular disease
      • Insulin resistance

    VAT is commonly associated with Apple (Oval) body shapes.

    Subcutaneous Fat

    • Stored beneath the skin
    • Common in hips and thighs
    • Metabolically less dangerous
    • In some cases, protective

    This pattern is typical of Pear (Triangle) shapes.

    Style Perspective: Proportional Harmony

    In fashion science, body shape acts as a structural blueprint.

    Designers use silhouette analysis to:

    • Balance visual proportions
    • Guide garment cuts and seam placement
    • Optimize fabric drape and volume

    The goal isn’t to “change” the body but to work with its geometry

    How to Measure Your Body Correctly (Step-by-Step)

    Accurate results depend on standardized anthropometric measurement.

    Measurement Guidelines

    • Use a soft, non-stretch tape
    • Stand upright in a relaxed posture
    • Do not pull the tape tightly
    • Measure directly on skin or thin clothing

    Key Measurements

    1. Shoulders

    Measure around the broadest part of the shoulders.

    2. Bust / Chest

    • Women: fullest part of the bust (wear a supportive, unpadded bra)
    • Men: fullest part of the chest

    3. Natural Waist

    The narrowest point of the torso, usually 1–2 inches above the navel.

    4. High Hip

    Upper hip area over the pelvic bones.

    5. Full Hip

    Widest part of the buttocks with feet together.

    Decoding the Primary Body Shape Types

    Hourglass (Balanced Shape)

    Math Criteria

    • Shoulders ≈ hips (within 5%)
    • Waist ≥ 25% smaller than bust and hips

    Health

    • Generally lower metabolic risk if waist remains within healthy limits

    Styling

    • Wrap tops
    • Belted dresses
    • Waist-defined silhouettes

    Triangle / Pear (Bottom-Heavy)

    Math Criteria

    • Hips ≥ 5% wider than shoulders or bust

    Health

    • Lower cardiometabolic risk
    • Possible joint strain (knees, hips)

    Styling

    • Boat necks
    • Statement shoulders
    • A-line skirts

    Inverted Triangle (Top-Heavy)

    Math Criteria

    • Shoulders or bust ≥ 5% wider than hips

    Health

    • Often athletic
    • Fat may accumulate in upper torso

    Styling

    • V-necklines
    • Flared skirts
    • Straight or wide-leg trousers

    Rectangle / Straight (Athletic)

    Math Criteria

    • Bust, waist, hips within 5%
    • Minimal waist indentation

    Health

    • Risk depends on muscle-to-fat ratio
    • Watch for “normal-weight obesity”

    Styling

    • Peplum tops
    • Layering
    • Structured tailoring

    Apple / Oval (Midsection-Heavy)

    Math Criteria

    • Waist equal to or larger than hips and bust

    Health

    • Highest metabolic risk
    • Strongly linked to visceral fat accumulation

    Styling

    • Empire waistlines
    • Vertical lines
    • Open blazers and long layers

    Advanced Metrics Used by Body Shape Calculators

    Waist-to-Hip Ratio (WHR)

    • Men: Risk > 0.90
    • Women: Risk > 0.85

    Waist-to-Height Ratio (WHtR)

    • Ideal: ≤ 0.5
    • Simple rule: Keep your waist under half your height

    Body Roundness Index (BRI)

    • Estimates total body fat and visceral fat
    • Height-independent
    • Increasingly used in research

    Hormones, Genetics, and Fat Distribution

    Your silhouette reflects biology, not willpower.

    Estrogen

    • Promotes fat storage in hips and thighs
    • Declines during menopause → shape shifts toward Apple

    Cortisol

    • Stress hormone
    • Drives visceral fat accumulation

    Insulin

    • High levels increase central fat storage
    • Strongly linked to abdominal obesity

    Genetics determine bone structure; lifestyle influences fat placement.

    Technology vs. Home Body Shape Calculators

    Home Calculators

    • ~98% accurate for silhouette classification
    • Ideal for health awareness and styling

    Clinical & Advanced Tools

    • DEXA scans: Bone density + regional fat
    • Bioelectrical Impedance (BIA): Fat vs muscle (hydration-sensitive)
    • 3D body scanners: Precision fashion and tailoring data

    Conclusion: Understanding, Not Fighting, Your Shape

    A body shape calculator represents a shift toward body neutrality and functional health.

    It acknowledges:

    • Bone structure is fixed
    • Fat distribution is modifiable
    • Health is about risk patterns, not appearance

    Whether your goal is metabolic health, smarter styling, or long-term wellness, understanding your body’s geometry gives you clarity, control, and confidence.

    Frequently Asked Questions (FAQs)

    Is a body shape calculator more accurate than BMI?

    Yes. BMI measures total mass only, while body shape calculators account for fat distribution, which is more predictive of health risks.

    Can my body shape change over time?

    Yes. Hormones, aging, stress, and fat gain or loss can shift your silhouette, though bone structure remains constant.

    Which body shape is healthiest?

    No shape is inherently “healthy,” but excess abdominal fat (Apple shape) carries higher metabolic risk.

    Do men have body shapes too?

    Absolutely. Men are commonly classified into rectangle, inverted triangle, oval, or trapezoid shapes.

    How often should I measure my body shape?

    Every 3–6 months is sufficient unless you are undergoing significant lifestyle or hormonal changes.


  • Determine Bra Size Calculator: The Complete, Accurate & Beginner-Friendly Guide (2026)

    Determine Bra Size Calculator: The Complete, Accurate & Beginner-Friendly Guide (2026)

    Finding the correct bra size is one of the most misunderstood yet essential aspects of women’s comfort, health, posture, and confidence. Despite millions of bras sold every year, a large percentage of women still wear the wrong size, not because they are careless, but because bra sizing systems are confusing, inconsistent, and poorly explained.

    1. What Is a Determining Bra Size Calculator?

    A Determine Bra Size Calculator is a digital tool that estimates your correct bra size using body measurements, primarily:

    • Underbust (band) measurement
    • Bust (cup) measurement

    Unlike outdated sizing charts or guess-based fittings, a calculator uses mathematical relationships between these measurements to suggest a size that balances:

    • Support
    • Comfort
    • Shape
    • Weight distribution

    Modern calculators are especially helpful for:

    • First-time bra wearers
    • Online shopping
    • Post-weight change
    • Pregnancy or postpartum phases
    Image


    2. Why Wearing the Correct Bra Size Matters

    Wearing the wrong bra size is not just uncomfortable, it can cause long-term physical issues.

    Health & Comfort Impacts

    Image
    • Shoulder pain from tight straps
    • Neck and upper-back strain
    • Poor posture
    • Skin irritation or rashes
    • Restricted breathing

    Appearance & Confidence

    • Poor clothing fit
    • Sagging or flattened appearance
    • Visible bra lines or overflow

    Psychological Impact

    Comfortable undergarments can significantly impact confidence, posture, and body awareness, particularly for teenagers and working women.

    A properly sized bra distributes weight through the band, not the shoulders. This is why accurate sizing matters.


    3. Common Bra Sizing Myths (That Cause Wrong Fits)

    ❌ Myth 1: “Cup Size Is the Same for Everyone.”

    A D cup is not universal. A 32D and 38D are completely different in volume.

    ❌ Myth 2: “Your Size Never Changes.”

    Weight changes, hormonal cycles, pregnancy, and aging all affect breast volume.

    ❌ Myth 3: “Tight Means Support.”

    Support comes from the band fit, not tight straps.

    ❌ Myth 4: “Store Fittings Are Always Correct.”

    Many fittings prioritize stock availability, not anatomical accuracy.

    A bra size calculator removes bias and relies on measurement logic.


    4. Understanding Bra Size Anatomy (Band + Cup)

    Image
    Image
    Image
    Image


    A bra size has two components:

    1️⃣ Band Size (Number)

    • Measured around the ribcage, just under the bust
    • Common sizes: 28, 30, 32, 34, 36, 38, 40+

    2️⃣ Cup Size (Letter)

    • Calculated from the difference between bust and underbust
    • Example:
      • 1 inch → A
      • 2 inches → B
      • 3 inches → C
      • 4 inches → D

    Cup size depends on band size, they are not independent.


    5. How to Measure Bra Size at Home (Step-by-Step)

    Image


    What You Need

    • Soft measuring tape
    • Non-padded bra (or no bra)
    • Mirror
    • Pen or notes app
    Image


    Step 1: Measure Underbust (Band)

    • Stand straight, exhale normally
    • Wrap tape snugly under your bust
    • Keep tape parallel to the floor

    📏 Round to the nearest whole number

    Image


    Step 2: Measure Bust

    • Measure at the fullest part of the bust
    • Tape should rest gently, not tight
    • Keep shoulders relaxed


    Step 3: Calculate Cup Size

    Cup Size = Bust – Underbust

    DifferenceCup
    1 inchA
    2 inchesB
    3 inchesC
    4 inchesD
    5 inchesDD / E

    Example

    • Underbust: 32 inches
    • Bust: 36 inches
      ➡ Bra Size: 32D

    A bra size calculator automates this accurately.


    6. How a Bra Size Calculator Works Internally

    A reliable calculator follows these steps:

    1. Normalizes measurements (rounding rules)
    2. Maps underbust to band size
    3. Computes cup volume difference
    4. Applies regional sizing logic
    5. Suggests sister sizes
    6. Accounts for edge cases (small band + large cup)

    Advanced calculators may also consider:

    • Body frame
    • Breast distribution
    • Measurement tolerance

    This is why calculators outperform static charts.

    7. Sister Sizes Explained (Why Multiple Sizes Can Fit)

    Image
    Image
    Image
    Image

    Sister sizes have the same cup volume but different band sizes.

    Example: 34C Sister Sizes

    • 32D
    • 36B

    Why this matters:

    • If band feels tight → go up a band, down a cup
    • If band feels loose → go down a band, up a cup

    A good bra size calculator always provides sister sizes.

    8. Age-Wise Bra Sizing Considerations (16–50)

    Ages 16–20

    • Growth still ongoing
    • Measure every 6–12 months
    • Avoid tight bands

    Ages 21–35

    • Most stable sizing phase
    • Changes with weight or workouts

    Ages 36–45

    • Hormonal shifts affect fullness
    • Support becomes more important

    Ages 46–50+

    • Breast tissue softens
    • Wider straps and full cups help

    A calculator adapts better than memory-based sizing.

    9. International Bra Size Conversion

    Image
    Image
    Image

    Different countries use different systems.

    USUKEU
    32D32D70D
    34C34C75C
    36DD36DD80E

    A smart bra size calculator automatically converts sizes for global shopping.

    10. Signs Your Bra Size Is Wrong

    🚩 Band Issues

    • Rides up → too big
    • Feels suffocating → too small

    🚩 Cup Issues

    • Spillage → cup too small
    • Wrinkling → cup too large

    🚩 Strap Issues

    • Digging → band not supporting
    • Slipping → wrong size or style

    If you notice two or more, re-measure.

    11. Bra Size Calculator vs In-Store Fitting

    FeatureCalculatorStore Fitting
    Privacy
    Bias-free
    Anytime access
    Stock-driven
    AccuracyHigh (if measured well)Variable

    Best practice: Use a calculator first, then confirm with fit testing.

    12. Final Thoughts: Comfort Is a Measurement, Not a Guess

    A Determine Bra Size Calculator removes confusion, marketing bias, and guesswork from one of the most personal clothing decisions a woman makes.

    Correct sizing means:

    • Better posture
    • Less pain
    • Better clothing fit
    • Greater confidence

    Your body is not “difficult” it’s simply unique. Measurement respects that.

    If you’re building or using a bra size calculator, prioritize clarity, education, and adaptability because sizing is not static, and neither are women.

    13. FAQs

    ❓ How often should I measure?

    Every 6–12 months or after weight/hormonal changes.

    Should I measure with a bra on?

    Use a non-padded bra or none.

    Are online calculators reliable?

    Yes, if they explain measurements clearly and show sister sizes.

    Is DD the largest size?

    No. Cup sizes continue (E, F, G…) depending on the system.